
5272道题目5525 条题源记录 · 相同内容已合并
线性建模・解释与预测进阶
At a school carnival, students can win colored tickets that are worth a different number of points depending on the color. One student won G green tickets and R red tickets worth a total of 520 points. The equation 60G + 70R = 520 represents this situation. How many more points is a red ticket worth than a green ticket?
原库参考解析
线性建模・解释与预测进阶
A model estimates that the population of a state was 4 million in 1980 and increased by 0.041 million each year until 2007. According to the model, what was the estimated population of this state, in millions, 10 years after 1980?
原库参考解析
线性建模・解释与预测进阶
\( w\left(t\right)=300-4t \)
The function w models the volume of liquid, in milliliters, in a container t seconds after it begins draining from a hole at the bottom. According to the model, what is the predicted volume, in milliliters, draining from the container each second?
原库参考解析
线性建模・解释与预测进阶
\( s=40+3t \)
The equation gives the speed s, in miles per hour, of a certain car t seconds after it began to accelerate. What is the speed, in miles per hour, of the car 5 seconds after it began to accelerate?
原库参考解析
线性建模・解释与预测挑战
Caleb used juice to make popsicles. The function \( f\left(x\right)=-5x+30 \) approximates the volume, in fluid ounces, of juice Caleb had remaining after making x popsicles. Which statement is the best interpretation of the y-intercept of the graph of \( y=f\left(x\right) \) in the xy-plane in this context?
原库参考解析
线性建模・解释与预测进阶
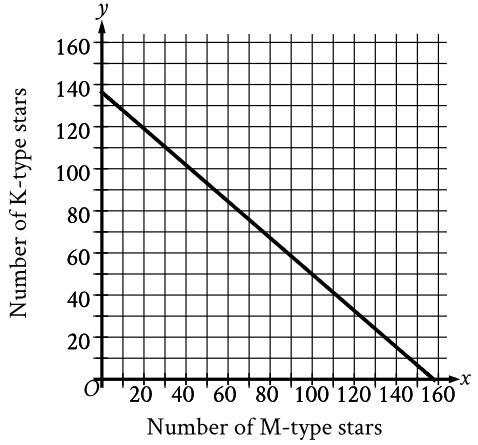
A certain open star cluster contains M-type stars and K-type stars. The estimated total mass of M-type and K-type stars in this open star cluster is 127,882 quettagrams. The graph shown models the possible combinations of the number of M-type stars, x, and K-type stars, y, that could be in this open star cluster if all the M-type stars have the same estimated mass and all the K-type stars have the same estimated mass. Based on the graph, which of the following is closest to the estimated mass, in quettagrams, of each M-type star in this cluster?
原库参考解析
线性建模・解释与预测挑战
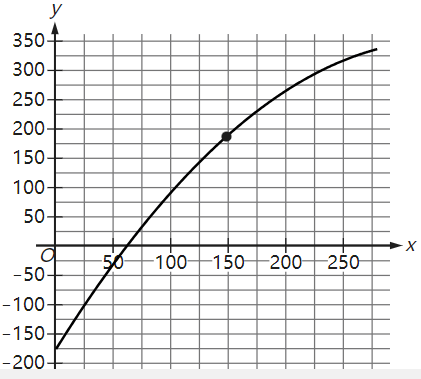
The graph shows the estimated boiling point , in degrees Celsius, of a normal paraffin with a molecular weight of x grams per mole, where \( 1\le x\le280 \). Which statement is the best interpretation of the point (149.02, 186.05)?
原库参考解析
线性建模・解释与预测进阶
5G +45R = 380
At a school fair, students can win colored tokens that are worth a different number of points depending on the color. One student won G green tokens and R red tokens worth a total of 380 points.The given equation represents this situation.How many more points is a red token worth than a green token?
原库参考解析
线性建模・解释与预测进阶
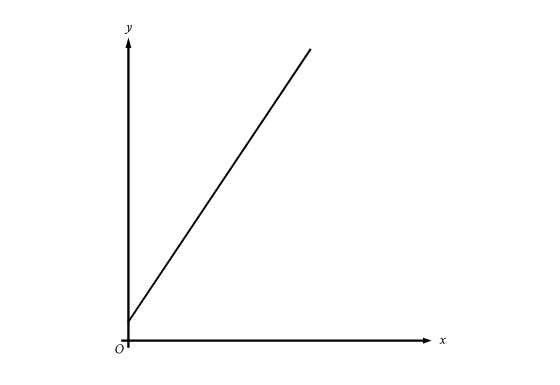
The graph represents the total charge, in dollars, by an electrician for x hours of work. The electrician charges a onetime fee plus an hourly rate. What is the best interpretation of the slope of the graph?
原库参考解析
线性建模・解释与预测挑战
A neighborhood consists of a 2-hectare park and a 35-hectare residential area. The total number of trees in the neighborhood is 3,934.The equation 2x +35y = 3,934 represents this situation. Which of the following is the best interpretation of x in this context?
原库参考解析
线性建模・解释与预测挑战
Keenan made 32 cups of vegetable broth.Keenan then filled x small jars and y large jars with all the vegetable broth he made.The equation 3x +5y = 32 represents this situation. Which is the best interpretation of 5y in this context?
原库参考解析
线性建模・解释与预测挑战
F(x)=
The function F gives the temperature, in degrees Fahrenheit, that corresponds to a temperature of x kelvins.If a temperature increased by 2.10 kelvins, by how much did the temperature increase, in degrees Fahrenheit?
原库参考解析