
5272道题目5525 条题源记录 · 相同内容已合并
函数图象・平移与特征挑战
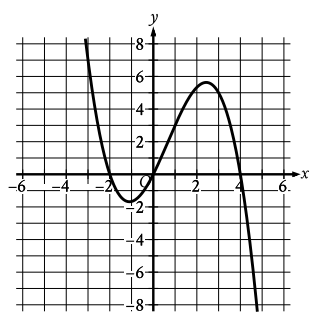
The complete graph of \( y=f(x) \) is shown. For how many values of x does \( f(x)=0 \)?
参考答案
函数图象・平移与特征进阶
The function \( g \) is defined by \( g(x)=−\frac{x}{3}+11. \)What is the \( x \)-intercept of the graph of \( y=g(x)+5 \) in the \( xy \)-plane?
参考答案
函数图象・平移与特征进阶
\( f(x)=\frac{a-14}{x}+6 \)
In the given function \( f \), \( a \) is a constant. The graph of function \( f \) in the xy-plane, where \( y=f(x) \), is translated 2 units down and 7 units to the right to produce the graph of \( y=g(x) \). Which equation defines function g?
In the given function \( f \), \( a \) is a constant. The graph of function \( f \) in the xy-plane, where \( y=f(x) \), is translated 2 units down and 7 units to the right to produce the graph of \( y=g(x) \). Which equation defines function g?
参考答案
函数图象・平移与特征基础
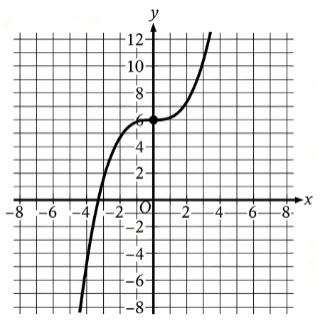
The graph of the function \( f \) is shown, where \( y=f(x) \). What is the value of \( f(0) \)?
参考答案
函数图象・平移与特征进阶
The function \( f \) is defined by \( f\left(x\right)=\left(x-10\right)\left(x-8\right)\left(x-4\right) \). In the xy-plane, the graph of \( y=g\left(x\right) \) is the result of translating the graph of \( y=f\left(x\right) \) up 6 units. What is the value of \( g\left(0\right) \) ?
原库参考解析
函数图象・平移与特征进阶
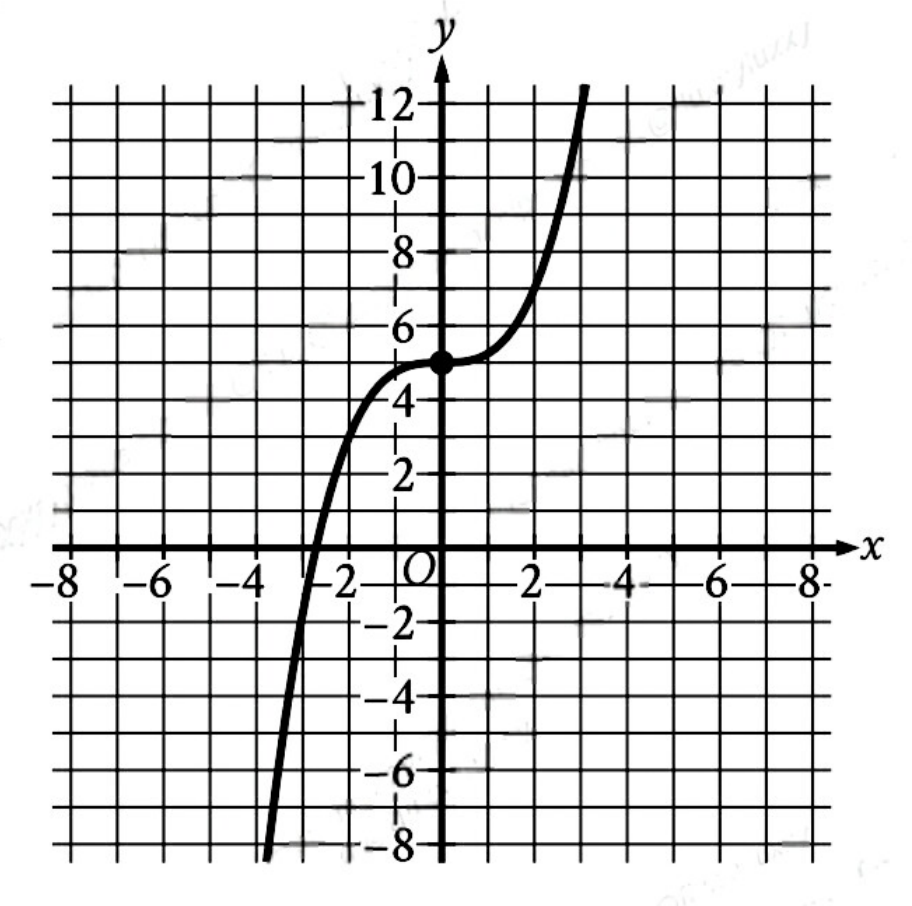
The graph of the function \( f\left(x\right) \) is shown, where \( y=f\left(x\right) \) .What is the value of \( f\left(0\right) \) ?
原库参考解析
函数图象・平移与特征基础
The function \( f \) is defined by \( f\left(x\right)=7x^3 \) . In the xy-plane, the graph of \( y=g\left(x\right) \) is the result of shifting the graph of \( y=f\left(x\right) \) down 2 units. Which equation defines function g?
原库参考解析
函数图象・平移与特征进阶
The graph of the function \( f \) is shown, where\( y=f\left(x\right) \).
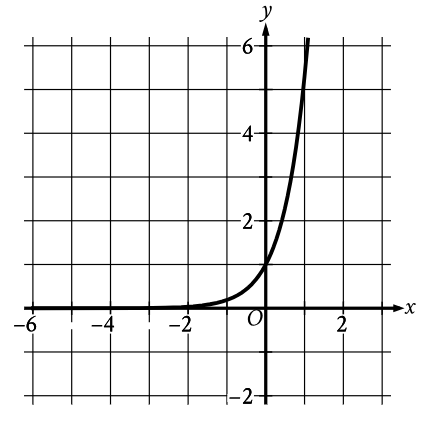
Which of the following best describes the function \( f \)?
原库参考解析
函数图象・平移与特征挑战
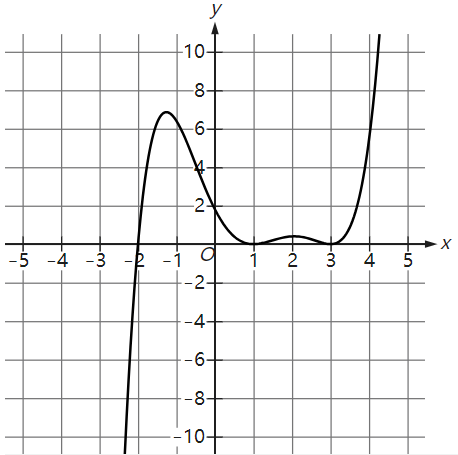
The graph of \( y=g(x) \) is shown. If \( g(x+28)=\frac{1}{10}(x-a)^2(x-b)^2(x-c) \) , where a, b, and c are constants, which of the following could be the value of b?
原库参考解析
函数图象・平移与特征挑战
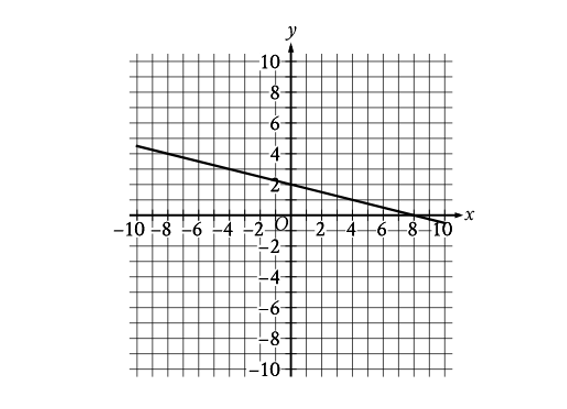
The graph of y = f(x) + 14 is shown. Which equation defines function f?
原库参考解析
函数图象・平移与特征基础
The line graph shows the estimated number of chipmunks in a state park on April 1 of each year from 1989 to 1999.
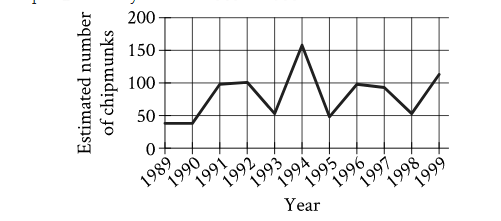
Based on the line graph, in which year was the estimated number of chipmunks in the state park the greatest?
原库参考解析
函数图象・平移与特征基础
Function f is defined by f(x)= (x + 6)(x + 5)(x + 1). Function g is defined by g(x)= f(x - 1). The graph of y = g(x) in the xy-plane has x-intercepts at (a, 0), (b, 0), and (c, 0), where a, b, and c are distinct constants. What is the value of a + b + c?
原库参考解析