
5272道题目5525 条题源记录 · 相同内容已合并
均值・中位数与集中趋势挑战
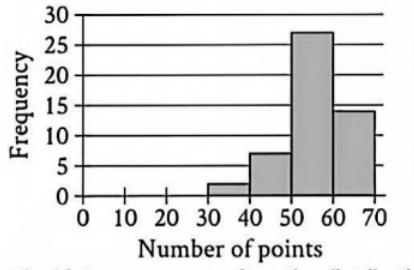
The histogram summarizes the distribution of an original data set that represents the number of points per game a basketball team has scored in the last 50 games played. If the team scores 18 points in the next game and this game is added to the original data set to create a new data set of 51 values, which of the following must be true?
I. The median number of points per game for the new data set is less than the median number of points per game for the original data set.
II. The mean number of points per game for the new data set is less than the mean number of points per game for the original data set.
参考答案
均值・中位数与集中趋势挑战
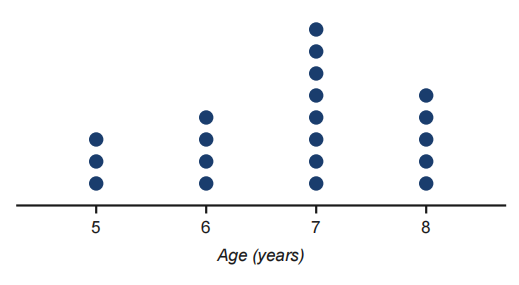
The dot plot represents an original data set of the ages of the 20 cards in a baseball card collection. A card that is 12 years old is added to the collection, resulting in a new data set of the ages of 21 cards. Which statement best compares the median of the original data set and the median of the new data set?
参考答案
均值・中位数与集中趋势基础
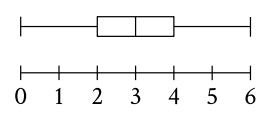
The box plot summarizes 15 data values. What is the median of this data set?
参考答案
均值・中位数与集中趋势进阶
A farmer gave two groups of chickens different types of chicken feed for a month to measure the effect on egg production. The lists give the number of eggs collected from each chicken in each of the two groups.
Group G: 8, 15, 18, 18, 24
Group H: 15, 18, 18, 24
Which statement correctly compares the median number of eggs collected for group G and the median number of eggs collected for group H?
Group G: 8, 15, 18, 18, 24
Group H: 15, 18, 18, 24
Which statement correctly compares the median number of eggs collected for group G and the median number of eggs collected for group H?
参考答案
均值・中位数与集中趋势进阶
12, 21, 23, 33, 39, 42, 44
The given list shows the 7 values in a data set. Which of the following data sets has the same median as the given list?
The given list shows the 7 values in a data set. Which of the following data sets has the same median as the given list?
参考答案
均值・中位数与集中趋势进阶
A farmer gave two groups of chickens different types of chicken feed for a month to measure the effect on egg production. The lists give the number of eggs collected from each chicken in each of the two groups.
Group G: 8, 15, 18, 18, 23
Group H: 15, 18, 18, 23
Which statement correctly compares the median number of eggs collected for group G and the median number of eggs collected for group H?
Group G: 8, 15, 18, 18, 23
Group H: 15, 18, 18, 23
Which statement correctly compares the median number of eggs collected for group G and the median number of eggs collected for group H?
参考答案
均值・中位数与集中趋势进阶
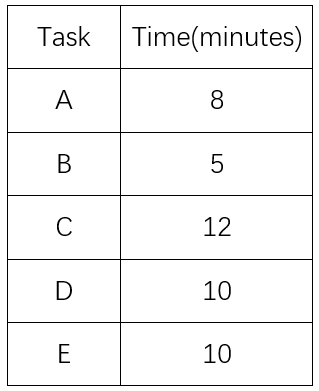
The table shows the amount of time it took a participant in a study to complete each of 5 tasks. What was the mean time, in minutes, for this participant to complete a task?
原库参考解析
均值・中位数与集中趋势进阶
Each of the following frequency tables represents a data set. Which data set has the greatest mean?
原库参考解析
均值・中位数与集中趋势挑战
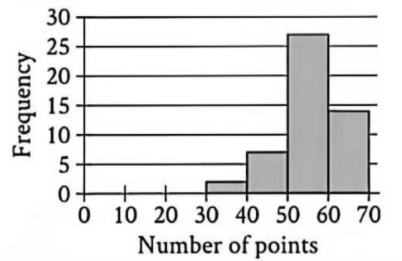
The histogram summarizes the distribution of an original data set that represents the number of points per game a basketball team has scored in the last 50 games played. If the team scores 18 points in the next game and this game is added to the original data set to create a new data set of 51 values, which of the following must be true?
I. The median number of points per game for the new data set is less than the median number of points per game for the original data set.
II. The mean number of points per game for the new data set is less than the mean number of points per game for the original data set.
原库参考解析
均值・中位数与集中趋势进阶
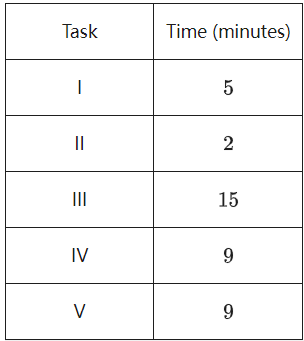
The table shows the amount of time it took Robert to complete each of the 5 tasks in a project. What was the mean time, in minutes, for Robert to complete a task for this project?
原库参考解析
均值・中位数与集中趋势挑战
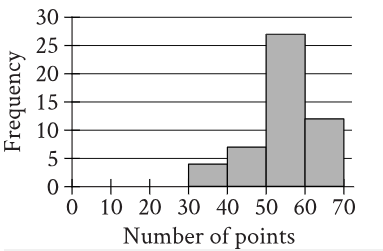
The histogram summarizes data set A, which represents the number of points per player earned by 50 players of a game. A new player earns 18 points playing the game, and this number of points is added to data set A to create data set B with 51 values. Which of the following must be true?
Ⅰ. The median number of points per player for data set B is less than the median number of points per player for data set A.
Ⅱ. The mean number of points per player for data set B is less than the mean number of points per player for data set A.
原库参考解析
均值・中位数与集中趋势基础
71,72,73,76,77,79,83,87,93
What is the median of the data shown?
原库参考解析