
ONE QUESTION, ONE STEP
ZX-468BDBCBD92026年9月国际A卷 · 第 8 题
2026年9月国际A卷 · 原库模块 1 · Q8 参考答案
The scatterplot shows the relationship between two variables, x and y. A line of best fit is also shown.
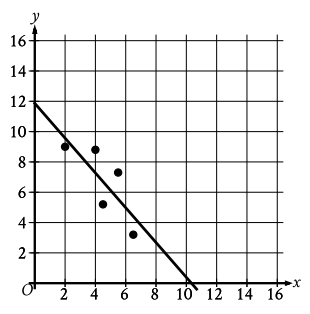
Which of the following is closest to the slope of this line of best fit?
Which of the following is closest to the slope of this line of best fit?
参考答案:
解题思路
容易忽略的一步

