
ONE QUESTION, ONE STEP
ZX-49FE4DC8AFBluebook试题4 · 第 4 题
Bluebook试题4 · 原库模块 2 · Q4 原库参考解析
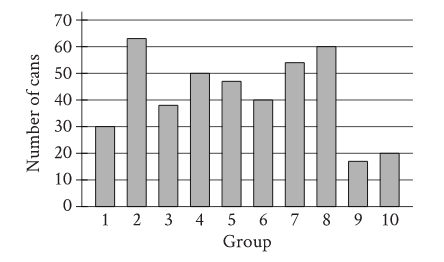
The bar graph shows the distribution of 419 cans collected by 10 different groups for a food drive. How many cans were collected by group 6?
参考答案:
解题思路
容易忽略的一步
ONE QUESTION, ONE STEP
ZX-49FE4DC8AFBluebook试题4 · 原库模块 2 · Q4 原库参考解析
参考答案:
Get in touch


小红书号 1330516766