
ONE QUESTION, ONE STEP
ZX-4ECD6744212024年6月C卷练习 · 第 6 题
2024年6月C卷练习 · 原库模块 1 · Q6 原库参考解析
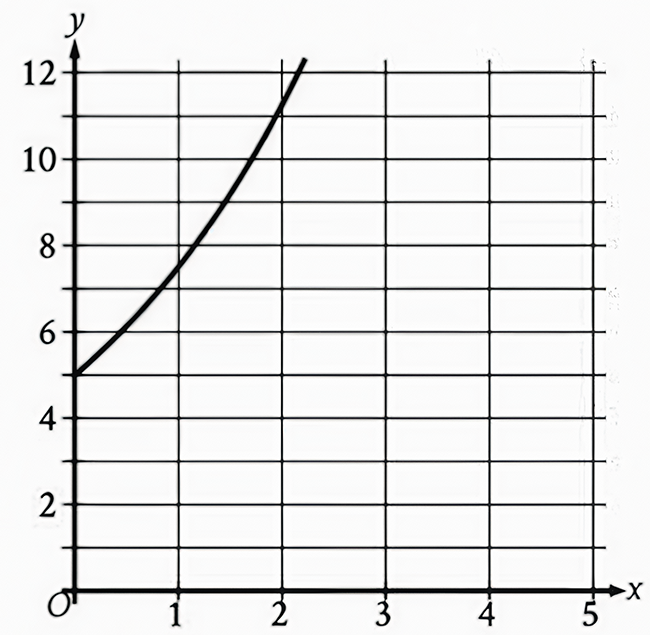
The graph gives the estimated population y, in thousands, of a town x years since 2007, where 0≤ x ≤5. Which of the following best describes the increase in the estimated population from x = 0 to x =1?
参考答案:
解题思路
容易忽略的一步

