
ONE QUESTION, ONE STEP
ZX-5C671917B5Bluebook试题8 · 第 1 题
Bluebook试题8 · 原库模块 2 · Q1 原库参考解析
The line graph shows the percent of cars for sale at a used car lot on a given day by model year.
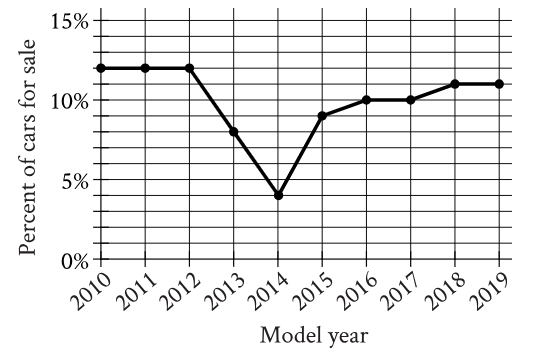
For what model year is the percent of cars for sale the smallest?
参考答案:
解题思路
容易忽略的一步

