
ONE QUESTION, ONE STEP
ZX-786239FF6FBluebook试题8 · 第 5 题
Bluebook试题8 · 原库模块 1 · Q5 原库参考解析
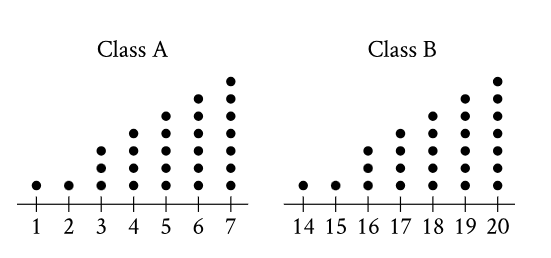
Each of the dot plots shown represents the number of glue sticks brought in by each student for two classes, class A and class B. Which statement best compares the standard deviations of the numbers of glue sticks brought in by each student for these two classes?
参考答案:
解题思路
容易忽略的一步

