
ONE QUESTION, ONE STEP
ZX-967D6DF0F22026年5月国际B卷(易) · 第 16 题
2026年5月国际B卷(易) · 原库模块 2 · Q16 原库参考解析
The scatterplot shows the relationship between x and y for the 9 data points in data set A.
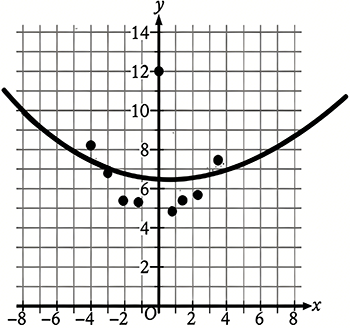
A quadratic model for the data in data set A can be written as \( y=0.04x^2-0.07x+6.52 \). The graph of this model is shown in the xy-plane. The data point at \( x=0 \) was found to be the result of a recording error and was removed from data set A to create data set B, consisting of the remaining 8 data points. A quadratic model for the data in data set B can be written as \( y=ax^2+bx+c \), where a, b, and c are constants. If the quadratic models for data sets A and B are calculated in the same way, which of the following statements must be true?
I. \( a>0.04 \)
II. \( c<6.52 \)
参考答案:
解题思路
容易忽略的一步

