
ONE QUESTION, ONE STEP
ZX-A9BD064B792024年5月C卷 · 第 10 题
2024年5月C卷 · 原库模块 1 · Q10 原库参考解析
The scatterplot shows the relationship between two variables, x and y.
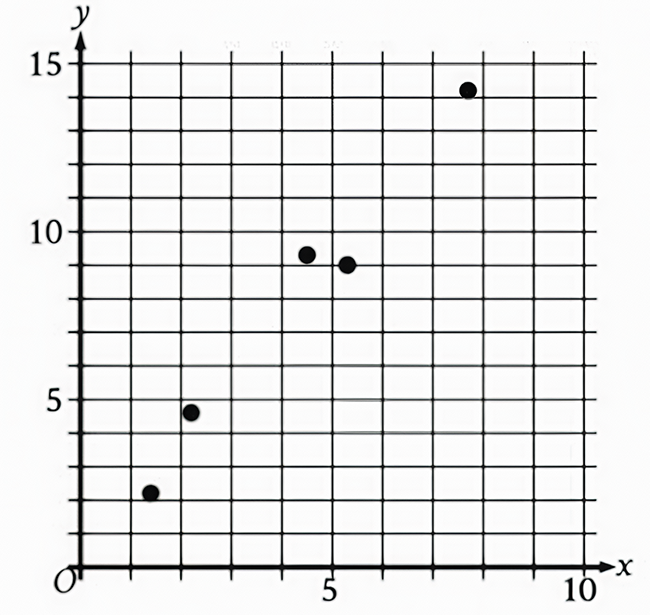
Which of the following equations is the most appropriate linear model for the data shown?
参考答案:
解题思路
容易忽略的一步

