
ONE QUESTION, ONE STEP
ZX-C1BB83454ABluebook试题11 · 第 3 题
Bluebook试题11 · 原库模块 2 · Q3 原库参考解析
To study the characteristics of sea stars in a group of tide pools, researchers measured the diameter of the sea stars within the tide pools. The dot plot gives the diameter, to the nearest inch, of each of the sea stars in these tide pools.
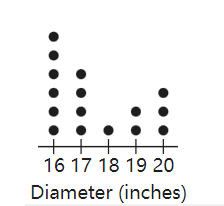
Based on the dot plot, how many sea stars had a diameter, to the nearest inch, of 16 inches?
参考答案:
解题思路
容易忽略的一步

