
ONE QUESTION, ONE STEP
ZX-E09A85C8F32026年5月国际B卷(易) · 第 7 题
2026年5月国际B卷(易) · 原库模块 1 · Q7 原库参考解析
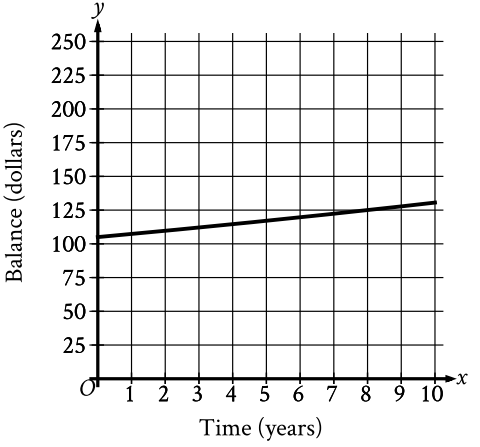
The graph shows the estimated balance of a bank account, in dollars, x years after an initial deposit is made. According to the graph, which of the following is closest to the number of years it took for the estimated balance to increase from the initial deposit to 125 dollars?
参考答案:
解题思路
容易忽略的一步

