
ONE QUESTION, ONE STEP
ZX-E281B0D61325年10月国际C卷练习 · 第 6 题
25年10月国际C卷练习 · 原库模块 1 · Q6 原库参考解析
The scatterplot shows the relationship between two variables, x and y. A line of best fit for the data is also shown.
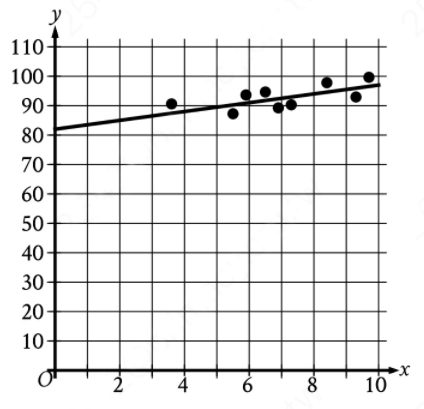
For how many of the 9 data points is the actual y-value greater than the y-value predicted by the line of best fit?
参考答案:
解题思路
容易忽略的一步

