
ONE QUESTION, ONE STEP
ZX-E33F8EC6902026年3月国际A卷 · 第 2 题
2026年3月国际A卷 · 原库模块 2 · Q2 原库参考解析
The scatterplot shows the temperature, in degrees Fahrenheit (°F), and the elevation, in feet, measured at 6 locations on a mountain. A line of best fit is also shown.
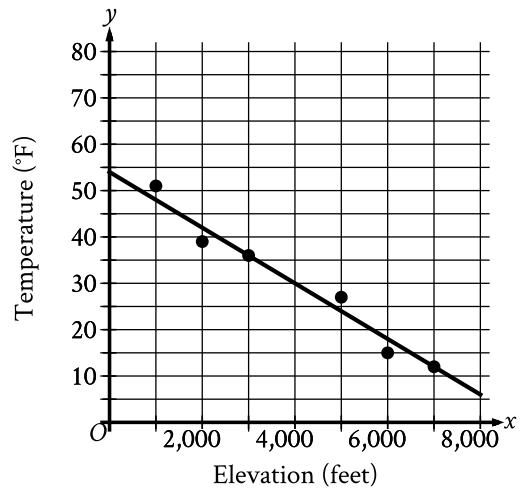
At an elevation of 4,000 feet, what is the temperature, in °F, predicted by the line of best fit?
参考答案:
解题思路
容易忽略的一步

