
ONE QUESTION, ONE STEP
ZX-FAD584E1D425年10月国际C卷练习 · 第 20 题
25年10月国际C卷练习 · 原库模块 1 · Q20 原库参考解析
The table shown summarizes the distribution of 65 employees based on the number of complete years they have worked at a certain company.
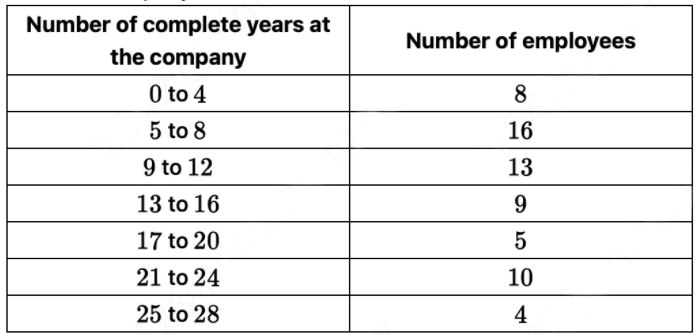
How many of the 65 employees have worked at the company for 21 or more complete years?
参考答案:
解题思路
容易忽略的一步

