
这部分需要会什么?
- 结合单位解释线性模型中的系数
- 利用模型预测并理解交点
- 区分模型的代数范围与实际适用范围
核心概念与公式
在 \(y=mx+b\) 中,\(m\) 表示 \(x\) 每增加 1,预测的 \(y\) 增加 \(m\);若 \(m<0\),表示减少。\(b\) 是输入为零时的模型值,只有 \(x=0\) 在情境中有意义时,才能解释为实际初始值。
两个费用模型的交点表示费用相等的输入;零点表示模型输出降到零的输入。利用观测范围内的输入作预测叫插值;超出范围的外推需要格外注意模型是否仍然适用。
做题时怎样使用
- 先读清变量定义,例如 \(t\) 是某年之后的年数还是具体年份
- 把斜率翻译成带有“每”和单位的句子
- 代入预测输入,并检查是否落在合理的时间、数量或测量范围内
容易混淆的地方
模型中的负斜率表示每单位减少固定量,不是减少固定百分比。若时间单位从年变为月,系数也要随之改变。
用一个例题串起方法
知识点教学例题水箱余水量满足 \(V=120-8t\),其中 \(V\) 以升计、\(t\) 以分钟计。解释系数并求水箱何时排空。
展开解题思路 +
初始有 120 升水,每分钟减少 8 升。令 \(V=0\),得 \(t=15\)。排空前模型的实际时间范围为 \(0\le t\le15\),不能把负水量当作真实结果。
本知识点题库
先独立作答,再查看答案与解析。
线性建模・解释与预测基础
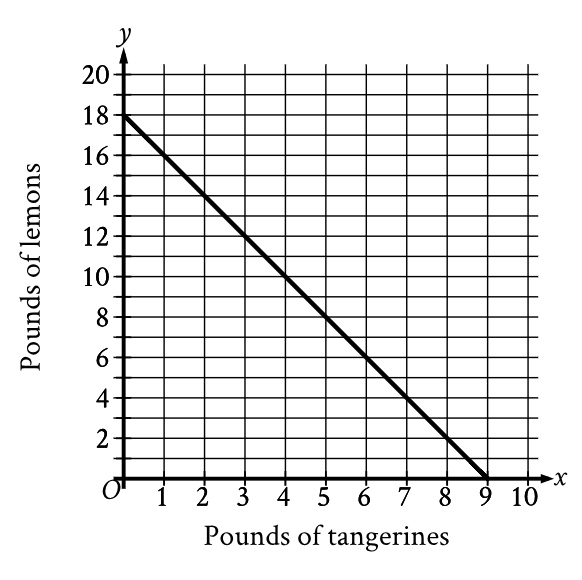
The graph shows the possible combinations of the number of pounds of tangerines and lemons that could be purchased for $18 at a certain store. If Melvin purchased lemons and 4 pounds of tangerines for a total of $18, how many pounds of lemons did he purchase?
原库参考解析
线性建模・解释与预测挑战
A linear model estimates the population of a city from 1991 to 2015. The model estimates the population was 57 thousand in 1991, 224 thousand in 2011, and x thousand in 2015. To the nearest whole number, what is the value of x?
原库参考解析
线性建模・解释与预测进阶
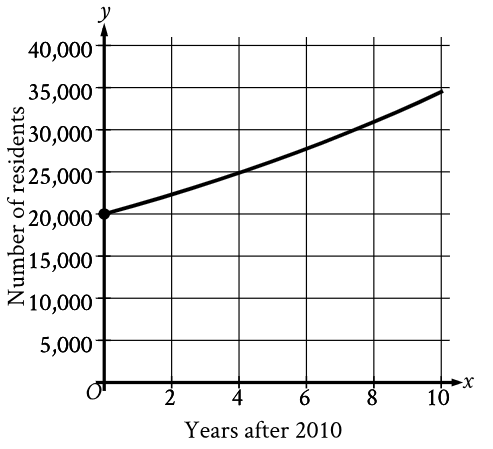
The graph shown models the number of residents of a certain city x years after 2010. How many residents does this model estimate the city had in 2010?
原库参考解析
线性建模・解释与预测挑战
As part of a science project on evaporation, Amaya measured the height of a liquid in a container over a period of time. The function \( f\left(x\right)=33-0.18x \) gives the estimated height, in centimeters (cm), of the liquid in the container x days after the start of the project. Which of the following is the best interpretation of 33 in this context?
原库参考解析
线性建模・解释与预测进阶
A model predicts that a certain animal weighed 241 pounds when it was born and that the animal gained 3 pounds per day in its first year of life. This model is defined by an equation in the form f(x) = a + bx , where f(x) is the predicted weight, in pounds, of the animal x days after it was born, and a and b are constants. What is the value of a ?
原库参考解析
线性建模・解释与预测挑战
A rectangle has a length that is 15 times its width. The function y =(15w)(w) represents this situation, where y is the area, in square feet, of the rectangle and y>0. Which of the following is the best interpretation of 15w in this context?
原库参考解析
线性建模・解释与预测进阶
\( d=16-\frac{x}{30} \)
The equation shown gives the estimated amount of diesel d, in gallons, that remains in the gas tank of a truck after being driven x miles, where\( 0\le x\le480 \). What is the estimated amount of diesel, in gallons, that remains in the gas tank of the truck when x = 300?
原库参考解析
线性建模・解释与预测挑战
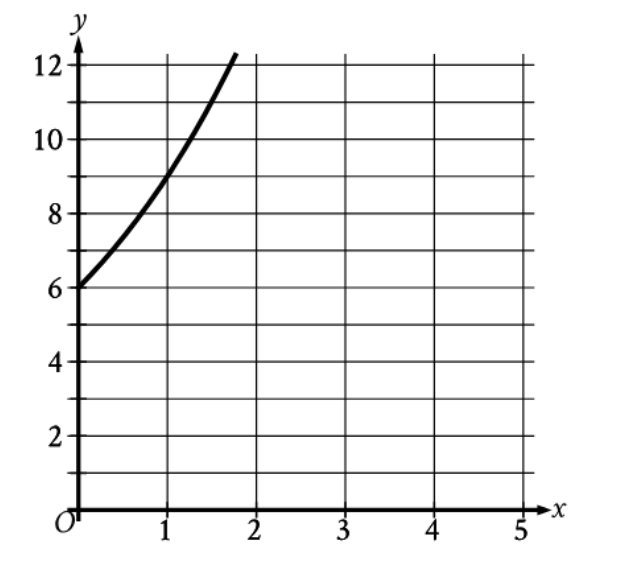
The graph gives the estimated population y, in thousands, of a town x years since 2003, where \( 0\le x\le5 \) . Which of the following best describes the increase in the estimated population from x = 0 to x = 1?
原库参考解析
线性建模・解释与预测进阶
A neighborhood consists of a 2-hectare park and a 35-hectare residential area. The total number of trees in the neighborhood is 3,934. The equation 2x +35y =3,934 represents this situation. Which of the following is the best interpretation of x in this context?
原库参考解析
线性建模・解释与预测挑战
s =40+3tThe equation gives the speed s, in miles per hour, of a certain car t seconds after it began to accelerate. What is the speed, in miles per hour, of the car 5 seconds after it began to accelerate?
原库参考解析
线性建模・解释与预测挑战
g(m) = −0.05m + 12.1The given function g models the number of gallons of gasoline that remains from a full gas tank in a car after driving m miles. According to the model, about how many gallons of gasoline are used to drive each mile?
原库参考解析
线性建模・解释与预测进阶
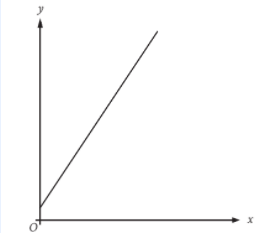
The graph represents the total charge, in dollars, by an electrician for x hours of work. The electrician charges a onetime fee plus an hourly rate. What is the best interpretation of the slope of the graph?
原库参考解析

