
这部分需要会什么?
- 计算均值、中位数与加权均值
- 根据均值反求总和或缺失数据
- 判断新增数据和极端值对集中趋势的影响
核心概念与公式
均值 \(\bar x=(x_1+\cdots+x_n)/n\),因此总和等于均值乘个数。中位数须先按大小排序;奇数个数据取中间一个,偶数个取中间两个的平均值。
合并两组数据时,整体均值为 \((n_1\bar x_1+n_2\bar x_2)/(n_1+n_2)\)。只有两组人数相同,才能直接平均两组均值。均值会被极端数值明显影响,中位数通常更稳定。
做题时怎样使用
- 先确认数据个数、频数和是否已经排序
- 求均值用总和;求中位数看位置;合并组别先还原各组总和
- 若数据改动,分别分析总和和排序位置如何变化
容易混淆的地方
频数表中的一个数可能出现多次,不能把每种数值只算一次。中位数的位置变化不等于数据总和变化。
用一个例题串起方法
知识点教学例题4 个数的均值为 12,加入第五个数后均值为 14。第五个数是多少?
展开解题思路 +
原总和为 \(4\times12=48\),新总和为 \(5\times14=70\)。加入的数为 \(70-48=22\)。
本知识点题库
先独立作答,再查看答案与解析。
均值・中位数与集中趋势进阶
Each value in the data set shown represents the height, in centimeters, of a plant.
6,10,13,2,15,22,10,4,4,4
What is the mean height, in centimeters, of these plants?
原库参考解析
均值・中位数与集中趋势挑战
| Value | Data set A frequency | Data set B frequency |
| 30 | 2 | 9 |
| 34 | 4 | 7 |
| 38 | 5 | 5 |
| 42 | 7 | 4 |
| 46 | 9 | 2 |
Data set A and data set B each consist of 27 values. The table shows the frequencies of the values for each data set. Which of the following statements best compares the means of the two data sets?
原库参考解析
均值・中位数与集中趋势进阶
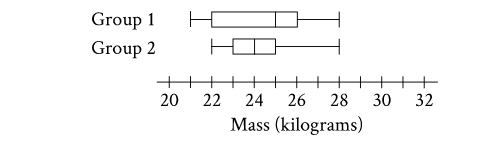
The box plots summarize the masses, in kilograms, of two groups of gazelles. Based on the box plots, which of the following statements must be true?
原库参考解析
均值・中位数与集中趋势挑战
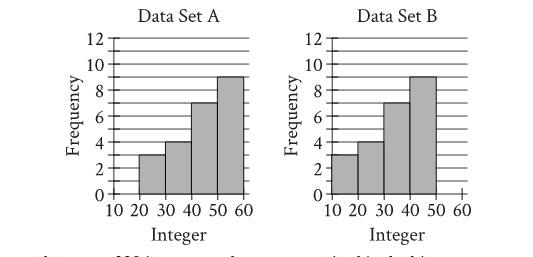
Two data sets of 23 integers each are summarized in the histograms shown. For each of the histograms, the first interval represents the frequency of integers greater than or equal to 10, but less than 20. The second interval represents the frequency of integers greater than or equal to 20, but less than 30, and so on. What is the smallest possible difference between the mean of data set A and the mean of data set B?
原库参考解析
均值・中位数与集中趋势进阶
Data set X:5,9, 9, 13
Data set Y:5, 9, 9, 13, 27
The lists give the values in data sets X and Y. Which statement correctly compares the mean of data set X and the mean of data set Y?
原库参考解析
均值・中位数与集中趋势挑战
Data set A consists of the heights of 75 buildings and has a mean of 32 meters. Data set B consists of the heights of 50 buildings and has a mean of 62 meters. Data set C consists of the heights of the 125 buildings from data sets A and B. What is the mean, in meters, of data set C?
原库参考解析
均值・中位数与集中趋势进阶
Five Eretmochelys imbricata, a type of sea turtle, each have a nest. The table shows an original data set of the number of eggs that each turtle laid in its nest.
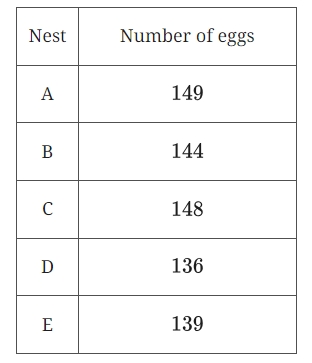
A sixth nest with 121 eggs is added to create a new data set, Which of the following correctly compares the means of the two data sets?
原库参考解析
均值・中位数与集中趋势挑战
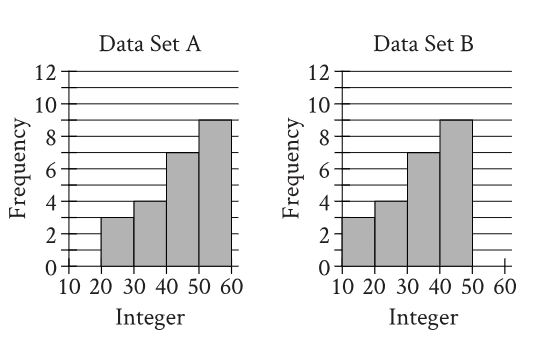
Two data sets of 23 integers each are summarized in the histograms shown. For each of the histograms, the first interval represents the frequency of integers greater than or equal to 10, but less than 20. The second interval represents the frequency of integers greater than or equal to 20, but less than 30, and so on. What is the smallest possible difference between the mean of data set A and the mean of data set B?
原库参考解析
均值・中位数与集中趋势挑战
73, 74, 75, 77, 79, 82, 84, 85, 91
What is the median of the data shown?
原库参考解析
均值・中位数与集中趋势挑战
Each of the following frequency tables represents a data set. Which data set has the greatest mean?
原库参考解析
均值・中位数与集中趋势挑战
The mean amount of time that the 20 employees of a construction company have worked for the company is 6.7 years. After one of the employees leaves the company, the mean amount of time that the remaining employees have worked for the company is reduced to 6.25 years. How many years did the employee who left the company work for the company?
原库参考解析
均值・中位数与集中趋势挑战
Data set A consists of the heights of 75 objects and has a mean of 25 meters. Data set B consists of the heights of 50 objects and has a mean of 65 meters. Data set C consists of the heights of the 125 objects from data sets A and B. What is the mean, in meters, of data set C ?
原库参考解析

