
这部分需要会什么?
- 从散点图识别正相关、负相关与非线性趋势
- 解释拟合直线的斜率和预测值
- 用观测值减预测值计算残差
核心概念与公式
散点图表示两变量的成对观测。拟合模型 \(\hat y=mx+b\) 给出预测值;残差定义为 \(y-\hat y\)。残差为正表示点在模型上方,为负表示点在模型下方。
拟合线描述整体趋势,不必通过每个点,也不保证预测准确。相关性不自动证明因果关系。远离观测范围的外推可能失效;明显弯曲的趋势通常不适合只用直线概括。
做题时怎样使用
- 先看变量与单位,再判断趋势方向和模型形式
- 把输入代入模型得到预测值
- 若求残差,使用实际值减预测值;若问系数含义,用单位解释
容易混淆的地方
残差的减法顺序不能颠倒。把拟合线看成所有观测都必须满足的精确等式,会误解数据。
用一个例题串起方法
知识点教学例题拟合模型为 \(\hat y=2.5x+8\)。当 \(x=6\) 时,实际观测值为 26,求残差。
展开解题思路 +
预测值 \(\hat y=2.5\times6+8=23\)。残差为 \(26-23=3\),观测点位于拟合线上方。
本知识点题库
先独立作答,再查看答案与解析。
散点图・拟合模型与残差进阶
During a study, the temperature, in degrees Celsius (°C), of the air in a chamber was recorded to the nearest integer at certain times. The scatterplot shows the recorded temperature y, in °C, of the air in the chamber x minutes after the start of the study.
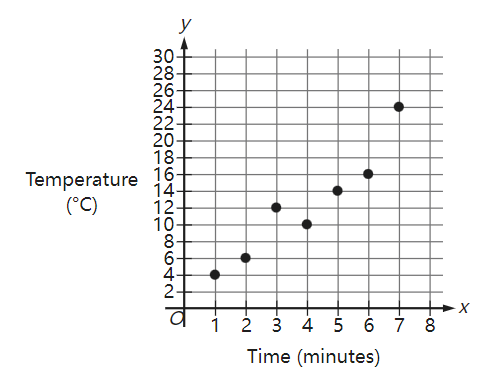
What was the average rate of change, in °C per minute, of the recorded temperature of the air in the chamber from\( x=5 \) to \( x=7 \) ?
原库参考解析
散点图・拟合模型与残差基础
The scatterplot shows the temperature, in degrees Fahrenheit (°F), and the distance above sea level, in feet measured at 6 locations on Mount Jefferson. A line of best fit is also shown.
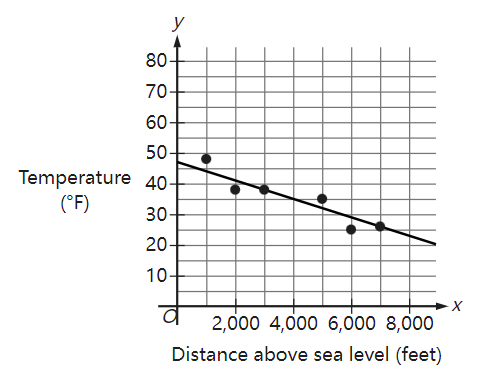
At a distance of 4,000 feet above sea level, what is the temperature, in °F, predicted by the line of best fit?
原库参考解析
散点图・拟合模型与残差挑战
In the given scatterplot, a line of best fit for the data is shown.
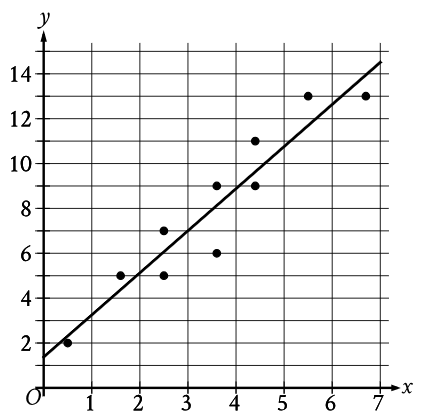
Which of the following is closest to the slope of the line of best fit shown?
原库参考解析
散点图・拟合模型与残差进阶
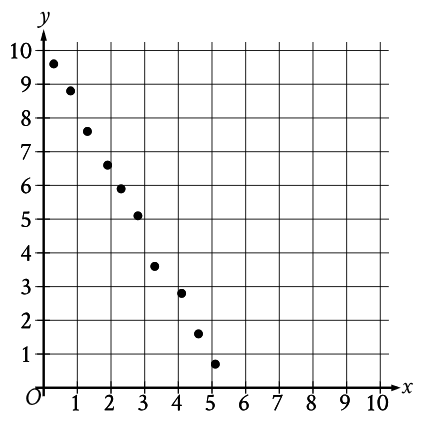
Which of the following equations is the most appropriate linear model for the data shown in the scatterplot?
原库参考解析
散点图・拟合模型与残差挑战
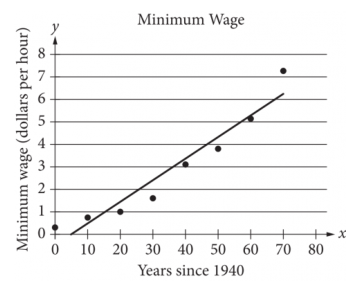
The scatterplot above shows the federal-mandated minimum wage every 10 years between 1940 and 2010. A line of best fit is shown, and its equation is y =0.096x - 0.488. What does the line of best fit predict about the increase in the minimum wage over the 70-year period?
原库参考解析
散点图・拟合模型与残差挑战
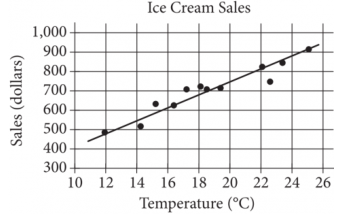
The scatterplot above shows a company’s ice cream sales d, in dollars, and the high temperature t, in degrees Celsius (°C), on 12 different days. A line of best fit for the data is also shown. Which of the following could be an equation of the line of best fit?
原库参考解析
散点图・拟合模型与残差挑战
The scatterplot shows the relationship between the length of time y , in hours, a certain bird spent in flight and the number of days after January 11, x .
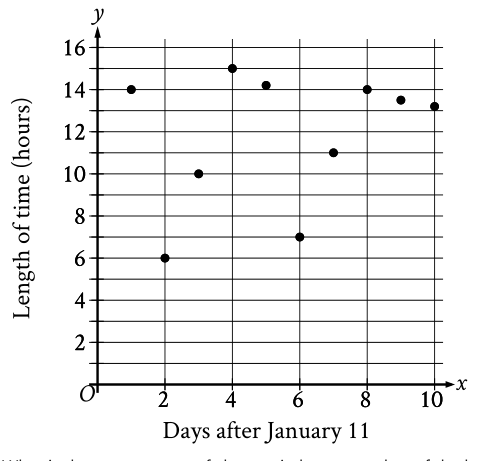
What is the average rate of change, in hours per day, of the length of time the bird spent in flight on January 13 to the length of time the bird spent in flight on January 15?
原库参考解析
散点图・拟合模型与残差挑战
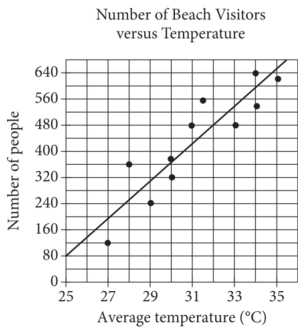
Each dot in the scatterplot above represents the temperature and the number of people who visited a beach in Lagos, Nigeria, on one of eleven different days. The line of best fit for the data is also shown. The line of best fit for the data has a slope of approximately 57. According to this estimate, how many additional people per day are predicted to visit the beach for each 5°C increase in average temperature?
原库参考解析
散点图・拟合模型与残差挑战
The scatterplot below shows the amount of electric energy generated, in millions of megawatt-hours, by nuclear sources over a 10‐year period.
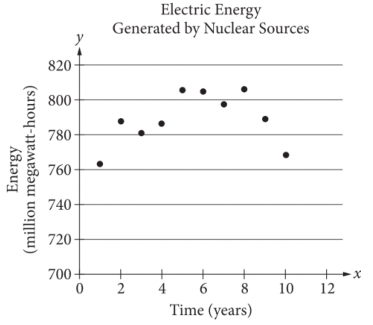
Of the following equations, which best models the data in the scatterplot?
原库参考解析
散点图・拟合模型与残差挑战
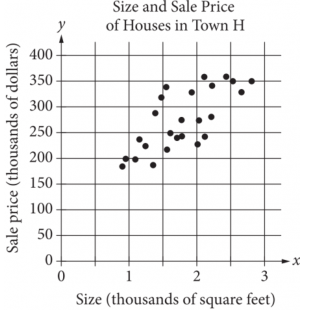
The scatterplot above shows the size x and the sale price y of 25 houses for sale in Town H. Which of the following could be an equation for a line of best fit for the data?
原库参考解析
散点图・拟合模型与残差挑战
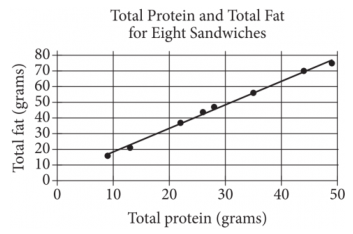
The scatterplot above shows the numbers of grams of both total protein and total fat for eight sandwiches on a restaurant menu. The line of best fit for the data is also shown. According to the line of best fit, which of the following is closest to the predicted increase in total fat, in grams, for every increase of 1 gram in total protein?
原库参考解析
散点图・拟合模型与残差进阶
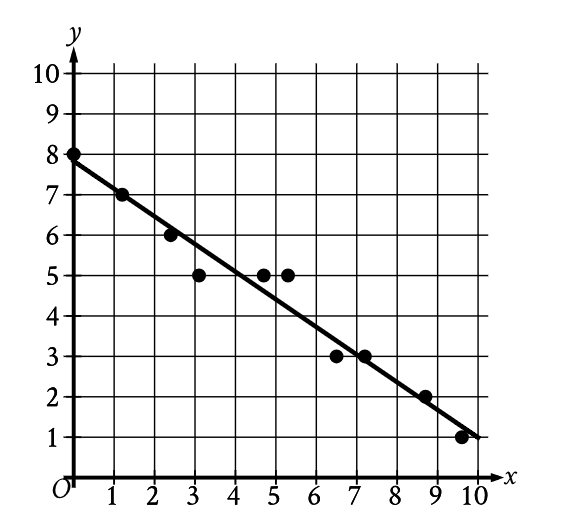
Which of the following is closest to the slope of this line of best fit?
原库参考解析

