
这部分需要会什么?
- 从频数表、直方图和箱线图读取分布
- 区分极差、四分位距与标准差
- 判断整体平移或缩放对离散程度的影响
核心概念与公式
极差为最大值减最小值;四分位距 \(IQR=Q_3-Q_1\),描述中间 50% 数据的跨度。标准差衡量数据围绕均值的离散程度,越集中通常越小;不能只凭极差相同就断定标准差相同。
全部数据加同一个常数时,均值和中位数同幅移动,但极差、四分位距和标准差不变。全部数据乘 \(c\) 时,标准差、极差和四分位距都乘 \(|c|\)。直方图通常只给出区间频数,未必能确定每个数据的精确值。
做题时怎样使用
- 先看坐标轴、组距、频数和总样本量
- 根据所问指标选用端点、四分位数或整体集中程度
- 比较变换前后时,判断是平移还是缩放,而不是重新猜测分布
容易混淆的地方
箱线图的箱体长度表示四分位距,不表示样本量。标准差不会为负;所有数据相同才有标准差为零。
用一个例题串起方法
知识点教学例题一组数据的均值为 10,标准差为 3。每个值先乘 2,再加 5,新的均值和标准差分别是多少?
展开解题思路 +
新均值为 \(2\times10+5=25\)。乘 2 使标准差变为 \(2\times3=6\),再加 5 不改变离散程度,所以标准差为 6。
本知识点题库
先独立作答,再查看答案与解析。
分布图表・极差与标准差挑战
The table shows the frequency of values in a data set.
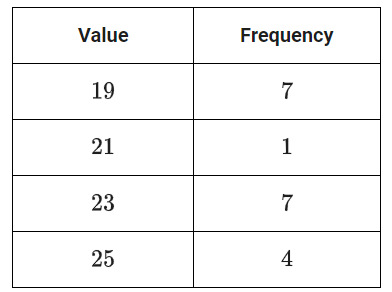
What is the minimum value of the data set?
原库参考解析
分布图表・极差与标准差基础
The bar graph shows the distribution of the number of walnuts per container for 20 containers at a grocery store.
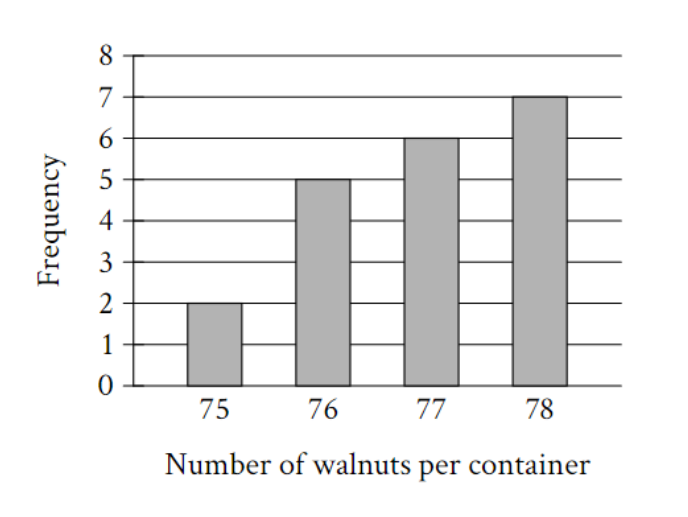
How many of these containers of walnuts contain exactly 78 walnuts?
原库参考解析
分布图表・极差与标准差进阶
| Data value | Frequency |
| 6 | 3 |
| 7 | 3 |
| 8 | 8 |
| 9 | 8 |
| 10 | 9 |
| 11 | 11 |
| 12 | 9 |
| 13 | 0 |
| 14 | 6 |
The frequency table summarizes the 57 data values in a data set. What is the maximum data value in the data set?
原库参考解析
分布图表・极差与标准差进阶
The line graph shows the percent of cars for sale at a used car lot on a given day by model year.
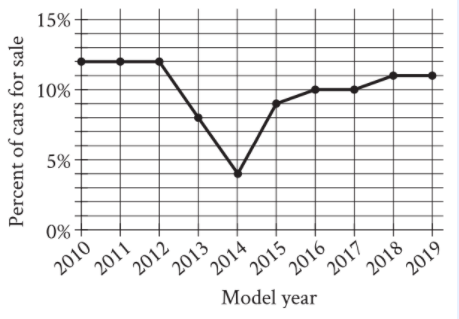
For what model year is the percent of cars for sale the smallest?
原库参考解析
分布图表・极差与标准差进阶
The bar graph shows the distribution of 419 cans collected by 10 different groups for a food drive. How many cans were collected by group 6?
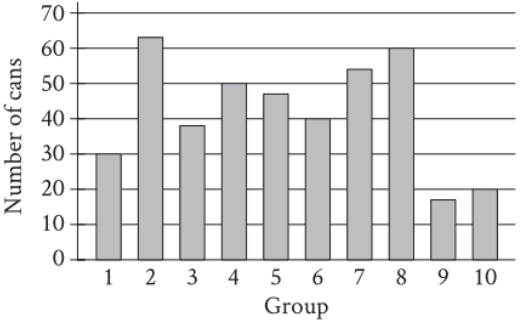
原库参考解析
分布图表・极差与标准差进阶
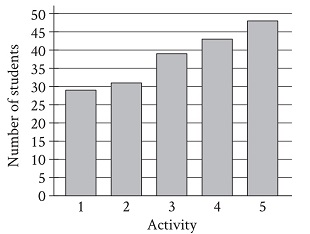
A group of students voted on five after-school activities. The bar graph shows the number of students who voted for each of the five activities. How many students chose activity 3?
原库参考解析
分布图表・极差与标准差挑战
The line graph shows the estimated number of chipmunks in a state park on April 1 of each year from 1989 to 1999.
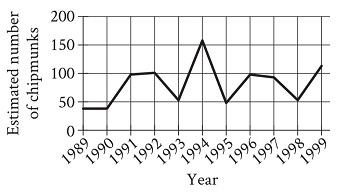
Based on the line graph, in which year was the estimated number of chipmunks in the state park the greatest?
原库参考解析
分布图表・极差与标准差挑战
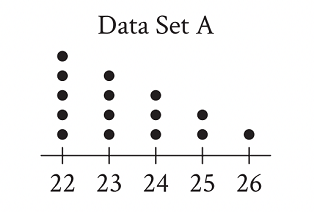
The dot plot represents the 15 values in data set A. Data set B is created by adding 56 to each of the values in data set A. Which of the following correctly compares the medians and the ranges of data sets A and B?
原库参考解析

