
5272道题目5525 条题源记录 · 相同内容已合并
均值・中位数与集中趋势进阶
2, 9, 14, 23, 32What is the mean of the data shown?
原库参考解析
均值・中位数与集中趋势挑战
Each of the following frequency tables represents a data set. Which data set has the greatest mean?
原库参考解析
均值・中位数与集中趋势基础
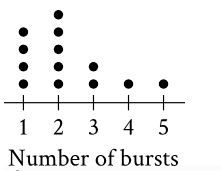
The dot plot represents a data set of the number of bursts for 13 eruptions of a steam vent. If an additional eruption with 11 bursts is added to this data set to create a new data set of 14 eruptions, which of the following measures will be greater for the new data set than for the original data set?
Ⅰ. The median number of bursts
Ⅱ. The mean number of bursts
原库参考解析
均值・中位数与集中趋势挑战
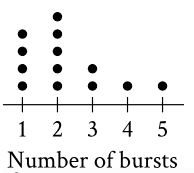
The dot plot represents a data set of the number of bursts for 13 eruptions of a steam vent. If an additional eruption with 11 bursts is added to this data set to create a new data set of 14 eruptions, which of the following measures will be greater for the new data set than for the original data set?
Ⅰ.The median number of bursts
Ⅱ.The mean number of bursts
原库参考解析
均值・中位数与集中趋势进阶
6, 6, 8, 8, 8, 10, 21
Which of the following lists represents a data set that has the same median as the data set shown?
原库参考解析
均值・中位数与集中趋势基础
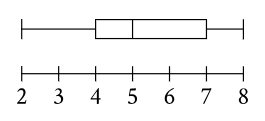
The box plot summarizes 15 data values. What is the median of this data set?
原库参考解析
均值・中位数与集中趋势进阶
The list gives the mass, in grams, of 5 alpine marmots.
4,010; 4,010; 3,030; 4,050; 3,050
What is the mean mass, in grams, of these 5 alpine marmots?
原库参考解析
均值・中位数与集中趋势挑战
A list of 10 data values is shown.
6, 8, 16, 4, 17, 26, 8, 5, 5, 5What is the mean of these data?
原库参考解析
分布图表・极差与标准差进阶
The table shows the frequency of values in a data set.
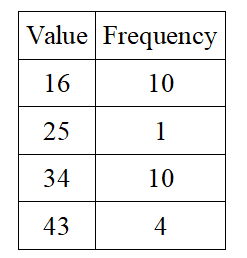
What is the minimum value of the data set?
原库参考解析
分布图表・极差与标准差挑战
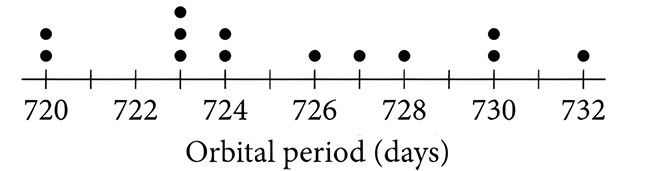
A data set of the orbital periods, rounded to the nearest whole number of Earth days, for 13 of Jupiter's moons is represented in the dot plot. An additional moon with an orbital period of 251 days is added to the original data set to create a new data set of 14 orbital periods. Which statement best compares the mean and median of the new data set to the mean and median of the original data set?
原库参考解析
分布图表・极差与标准差挑战
The table summarizes the UV index value recorded by a research assistant at noon each day for 48 days.
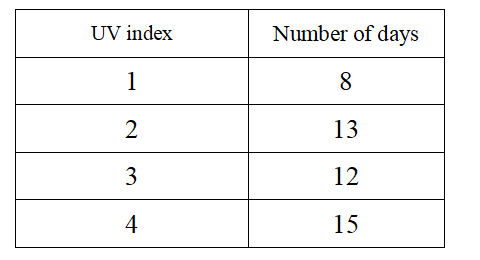
According to the table, a UV index value of 1 was recorded on how many days?
原库参考解析
分布图表・极差与标准差挑战
Which of the following choices has the least standard deviation?
原库参考解析