
5272道题目5525 条题源记录 · 相同内容已合并
分布图表・极差与标准差进阶
The table summarizes the UV index value recorded by a research assistant at noon each day for 49 days.
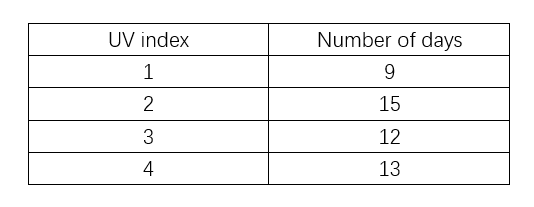
According to the table, a UV index value of 1 was recorded on how many days?
原库参考解析
分布图表・极差与标准差进阶
The table summarizes the UV index value recorded by a research assistant at noon each day for 49 days.
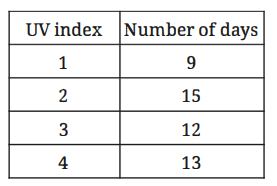
According to the table, a UV index value of 1 was recorded on how many days?
原库参考解析
分布图表・极差与标准差挑战
Data set A: 24,34,44,54,64
Data set A, which consists of the 5 values shown, has a mean of 44 and a standard deviation of approximately 14.10. Data set B consists of the 5 values from data set A and one additional value,k. For which of the following values of k will the standard deviation of data set B be less than the standard deviation of data set A?
原库参考解析
分布图表・极差与标准差进阶

The dot plot shows the distribution of capacity for a set of capacitors, set A, which a researcher used for a certain experiment. For another experiment, the researcher used a different set of capacitors, set B. Set B has the same number of capacitors as set A but the capacity of each capacitor of set B is 17 microfarads (\( μ \)F) greater than the capacity of each respective capacitor in set A. Which of the following is true about the capacities of the capacitors in set B?
原库参考解析
分布图表・极差与标准差挑战
The bar graph shows the distribution of flower type for the 700 flowers that a florist has in stock.
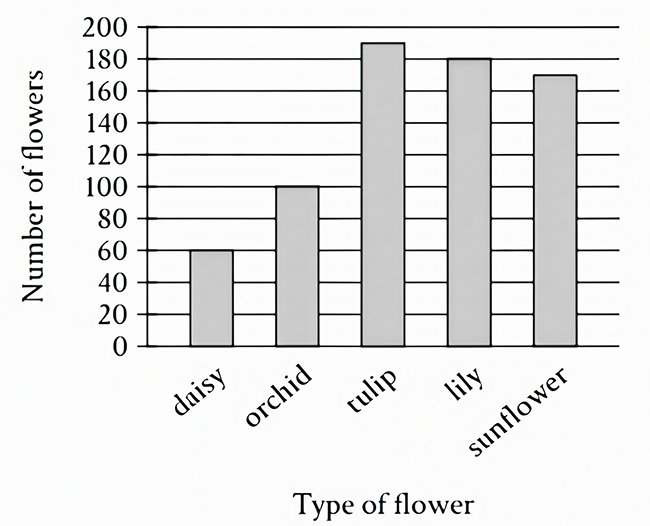
For which two types of flowers is the total number of flowers of the two types exactly \( \frac{2}{5} \) of the florist's stock?
原库参考解析
分布图表・极差与标准差挑战

The histogram summarizes a data set of the weights, in pounds, of 14 salmon. If an additional weight of 66 pounds is added to the original data set to create a new data set of 15 weights of salmon, which of the following measures must be greater for the new data set than for the original data set?
I. The median
II. The mean
原库参考解析
分布图表・极差与标准差挑战
The table shows the frequency of values in a data set.
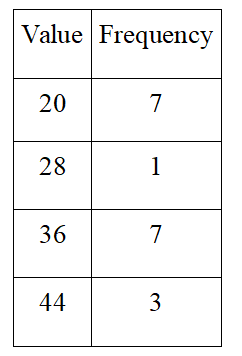
What is the minimum value of the data set?
原库参考解析
分布图表・极差与标准差挑战
A zoologist observed the nests of wood ducks in an area.Each year, the zoologist recorded the number of eggs in each of the first 30 nests that were observed and created a frequency table for the data set. Which of the following frequency tables represents the data set with the smallest standard deviation?
原库参考解析
分布图表・极差与标准差挑战

The histograms summarize the distributions of scores for team A and team B. Which statement best compares the standard deviations of scores for these teams?
原库参考解析
分布图表・极差与标准差挑战
Each of the following frequency tables represents a data set. Which of these frequency tables represents the data set with the smallest standard deviation?
原库参考解析
分布图表・极差与标准差挑战

The histogram summarizes a data set of the weights, in pounds, of 14 salmon. If an additional weight of 68 pounds is added to the original data set to create a new data set of 15 weights of salmon, which of the following measures must be greater for the new data set than for the original data set?
Ⅰ. The median
Ⅱ. The mean
原库参考解析
分布图表・极差与标准差进阶
The bar graph shows the frequency of each data value in a data set.

What is the frequency of data value 2 in this data set?
原库参考解析