
5272道题目5525 条题源记录 · 相同内容已合并
散点图・拟合模型与残差进阶
For the first hours of an experiment, the scatterplot shows the temperature y, in degrees Fahrenheit (°F) of an object at various times x, in hours, since the start of the experiment. A line of best fit is also shown.
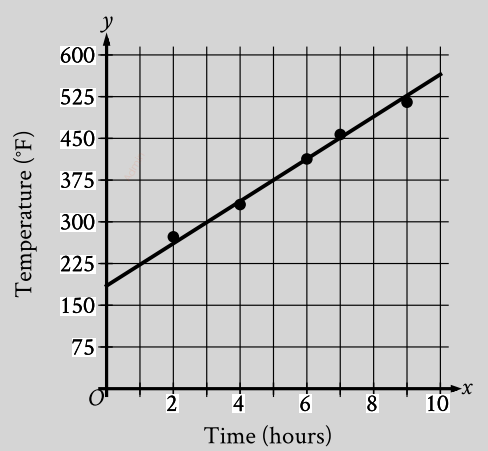
Which of the following is the best interpretation of the slope of the line of best fit?
原库参考解析
散点图・拟合模型与残差进阶
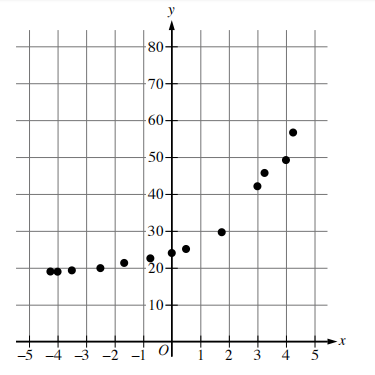
Which of the following equations is the most appropriate model for the data shown in the scatterplot?
原库参考解析
散点图・拟合模型与残差挑战
A group of 10 gardeners recorded data on the germination rates of their tomato crop for one growing season. The scatterplot shows the relationship between the number of tomato seeds planted, x, and the number of tomato seeds that germinated, y, for each of the gardeners. A line of best fit is also shown.
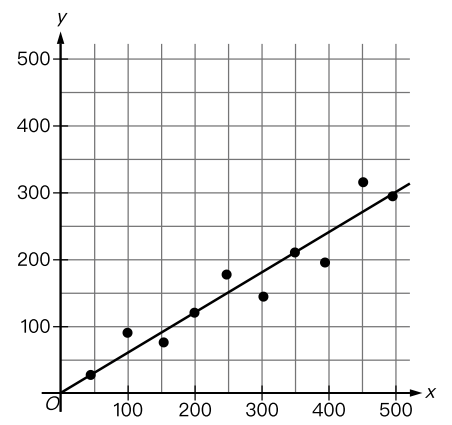
Which of the following is the best interpretation of the slope of the line of best fit in this context?
原库参考解析
散点图・拟合模型与残差进阶
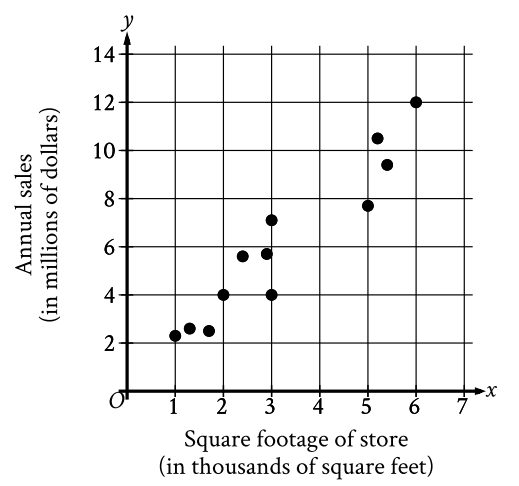
The scatterplot shows the relationship between the square footage of 12 clothing stores and their annual sales, in millions of dollars. According to the trend shown by the data, which of the following is the best prediction for the annual sales, in millions of dollars, of a clothing store that is 4 thousand square feet?
原库参考解析
散点图・拟合模型与残差进阶
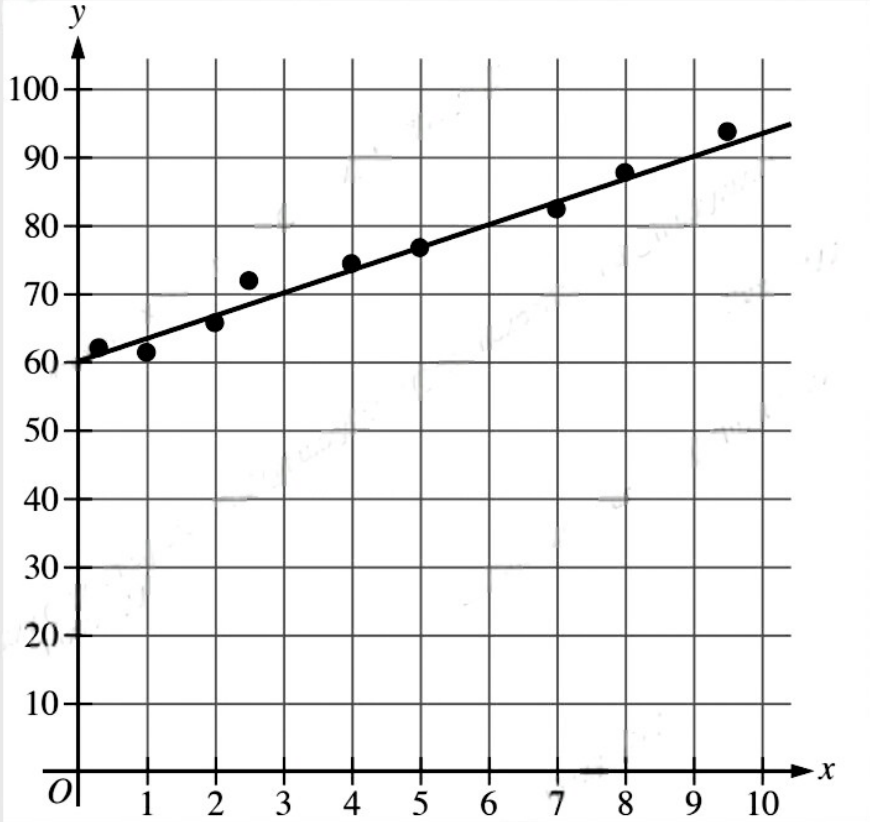
The scatterplot has 9 data points.For how many of the 9 data points is the actual y-value greater than the y-value predicted by the line of best fit?
原库参考解析
散点图・拟合模型与残差挑战
The scatterplot shows the relationship between two variables, x and y.
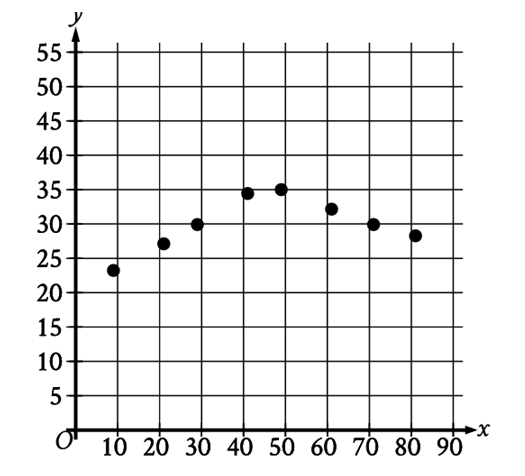
Which of the following equations is the most appropriate quadratic model for the data shown?
原库参考解析
散点图・拟合模型与残差进阶
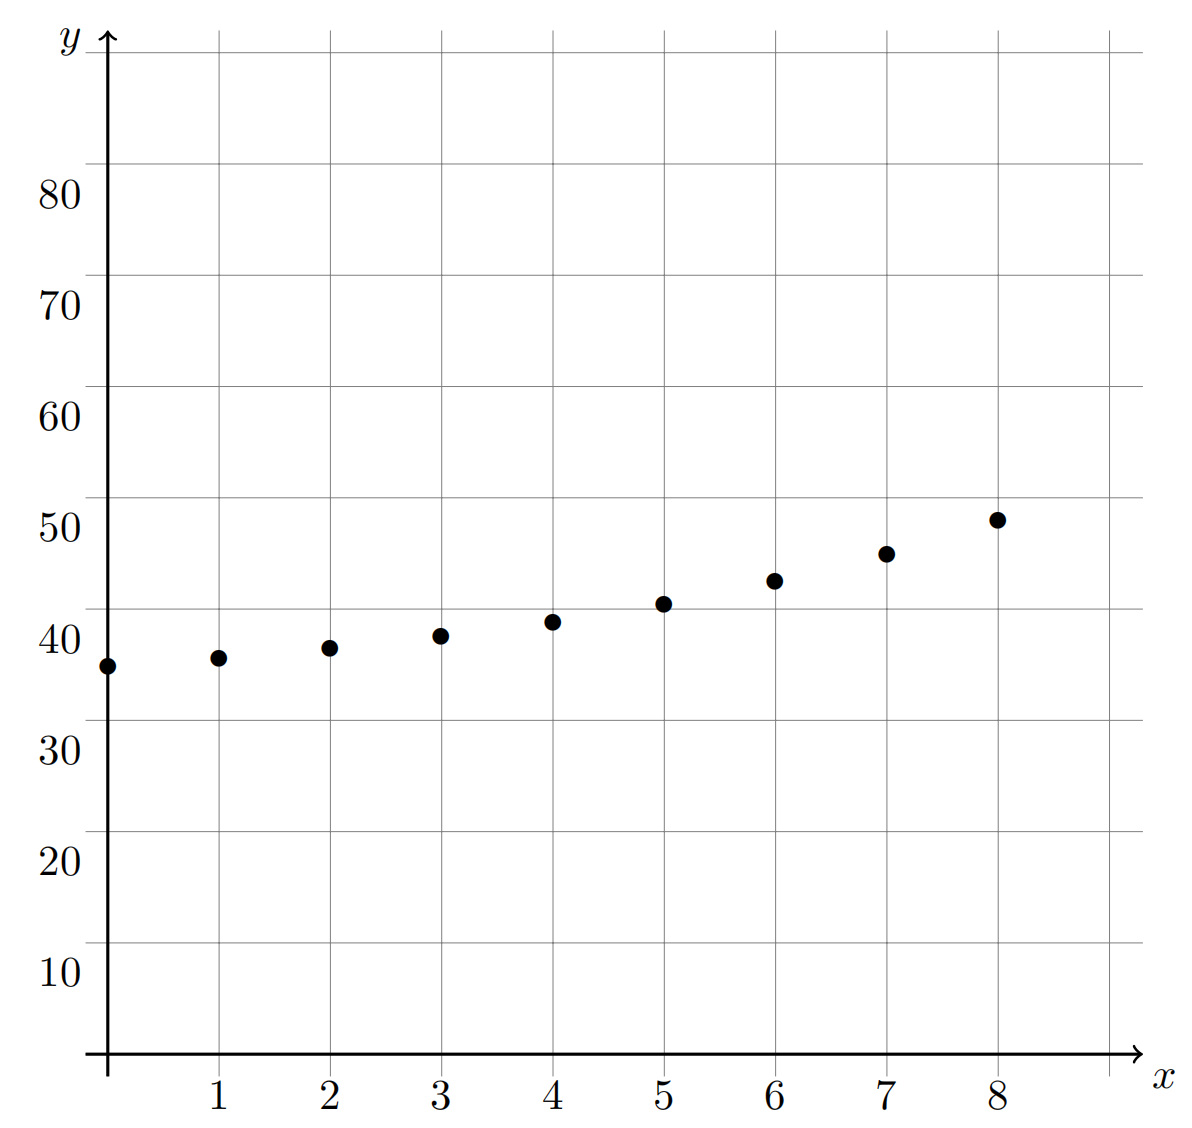
Which of the following equations is the most appropriate exponential model for the data shown in the scatterplot?
原库参考解析
散点图・拟合模型与残差挑战
The scatterplot shows the relationship between the weight, in pounds, of each of 9 pregnant beavers on April 30 and the number of offspring each beaver produced.
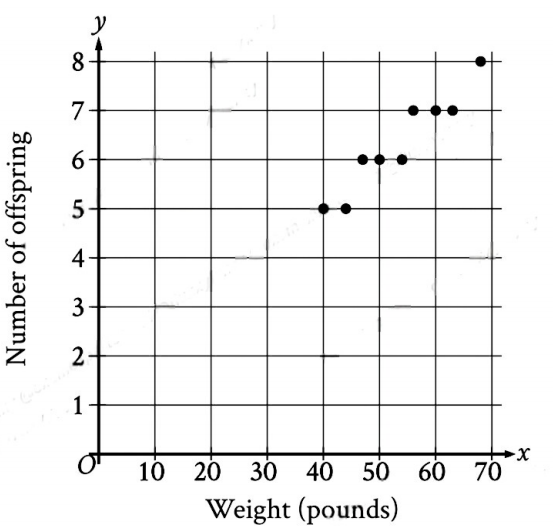
How many offspring did the 50-pound beaver produce?
原库参考解析
散点图・拟合模型与残差挑战
The scatterplot shows the relationship between two variables, x and y. A line of best fit is also shown.
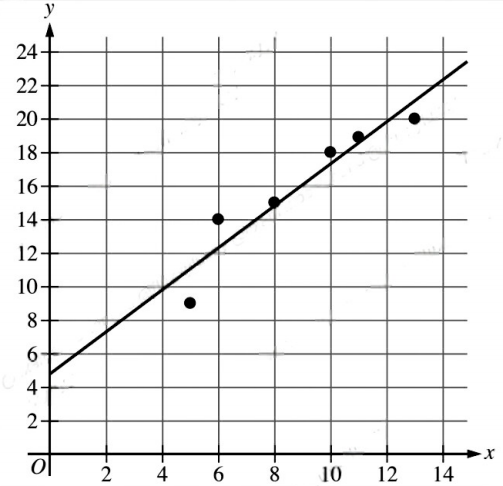
Which of the following is closest to the slope of this line of best fit?
原库参考解析
散点图・拟合模型与残差基础
The scatterplot shows the temperature, in degrees Fahrenheit (°F), and the elevation, in feet, measured at 6 locations on a mountain. A line of best fit is also shown.
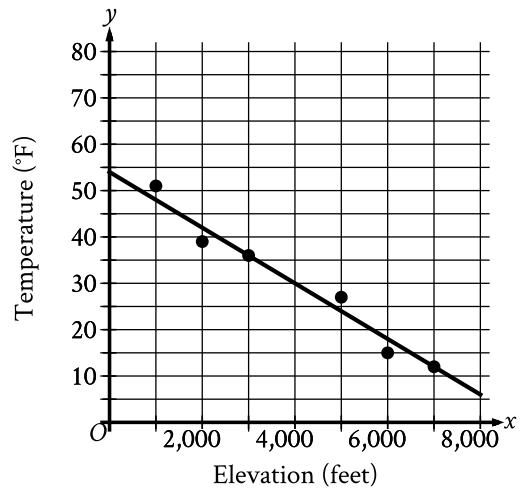
At an elevation of 4,000 feet, what is the temperature, in °F, predicted by the line of best fit?
原库参考解析
散点图・拟合模型与残差挑战
The scatterplot shows the relationship between two variables, t and d.
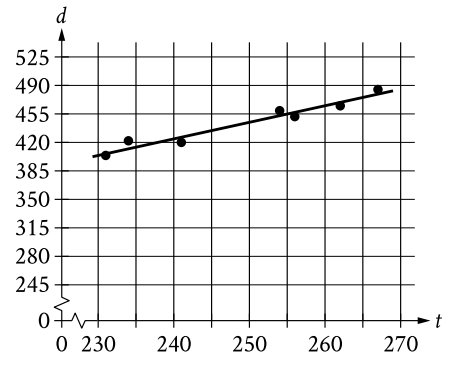
Which of the following equations is the most appropriate linear model for the data shown?
原库参考解析
散点图・拟合模型与残差挑战
The scatterplot shows the relationship between the number of whooping cranes, y, in a certain population and the number of years since 1960, x, where \( 0\le x\le50 \) .
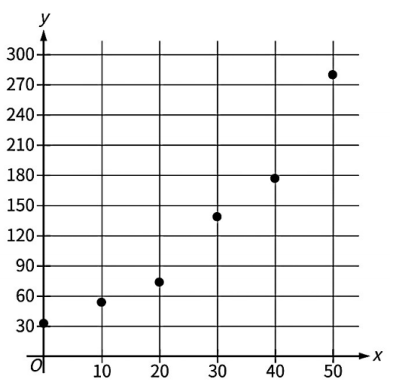
Which of the following equations is the most appropriate exponential model for the data shown in the scatterplot?
原库参考解析