
5272道题目5525 条题源记录 · 相同内容已合并
散点图・拟合模型与残差挑战
The scatterplot shows the relationship between two variables, x and y.
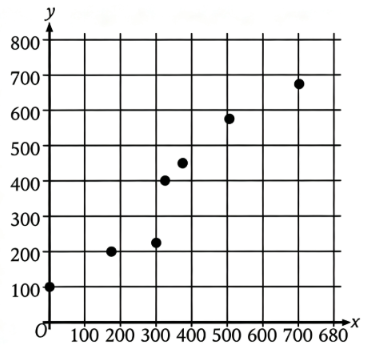
Which of the following equations is the most appropriate linear model for the data shown?
Which of the following equations is the most appropriate linear model for the data shown?
参考答案
散点图・拟合模型与残差进阶
The scatterplot shows the relationship between two variables, x and y. A line of best fit for the data is also shown.
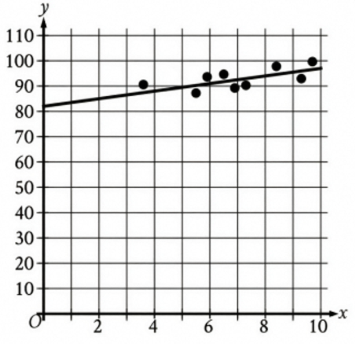
For how many of the 9 data points is the actual y-value greater than the y-value predicted by the line of best fit?
For how many of the 9 data points is the actual y-value greater than the y-value predicted by the line of best fit?
参考答案
散点图・拟合模型与残差挑战
The scatterplot shows the relationship between two variables, x and y. A line of best fit for the data is also shown.
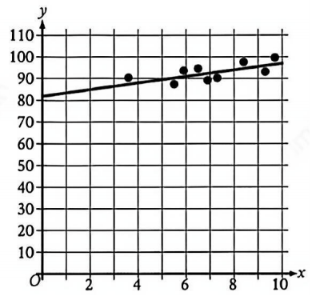
For how many of the 9 data points is the actual y-value greater than the y-value predicted by the line of best fit?
For how many of the 9 data points is the actual y-value greater than the y-value predicted by the line of best fit?
参考答案
散点图・拟合模型与残差进阶
In the scatterplot, a line of best fit for the data is shown.
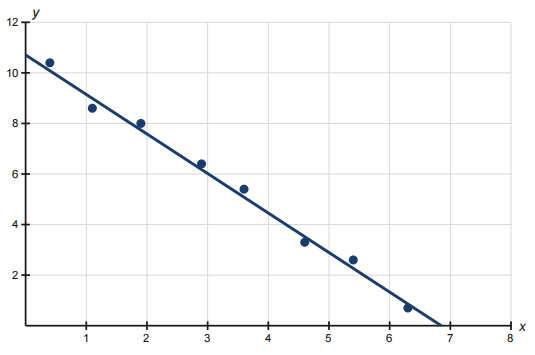
Which of the following equations best represents this line of best fit?
Which of the following equations best represents this line of best fit?
参考答案
散点图・拟合模型与残差进阶
The scatterplot shows the relationship between two variables, x and y. A line of best fit is also shown.
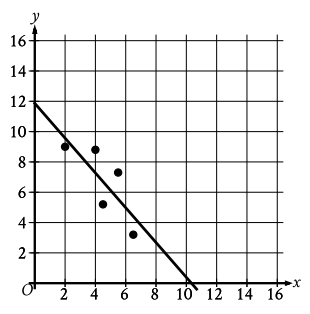
Which of the following is closest to the slope of this line of best fit?
Which of the following is closest to the slope of this line of best fit?
参考答案
散点图・拟合模型与残差基础
The scatterplot shows the relationship between two variables, x and y.
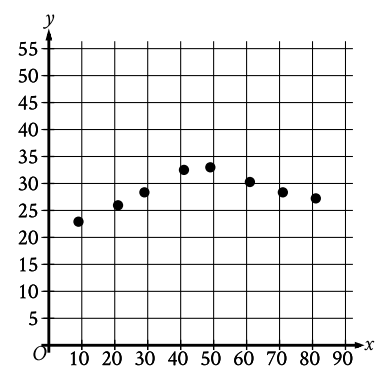
Which of the following equations is the most appropriate quadratic model for the data shown?
Which of the following equations is the most appropriate quadratic model for the data shown?
参考答案
散点图・拟合模型与残差挑战
The scatterplot shows the relationship between two variables, x and y.
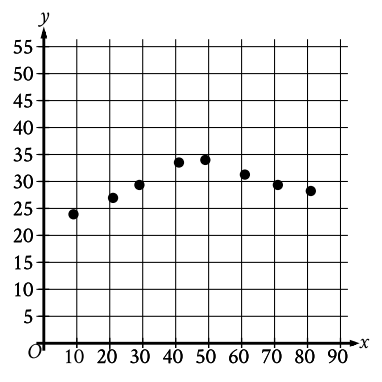
Which of the following equations is the most appropriate quadratic model for the data shown?
Which of the following equations is the most appropriate quadratic model for the data shown?
参考答案
散点图・拟合模型与残差基础
The scatterplot shows the relationship between two variables, x and y. A line of best fit is also shown.
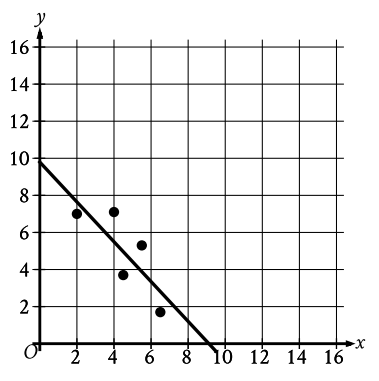
Which of the following is closest to the slope of this line of best fit?
Which of the following is closest to the slope of this line of best fit?
参考答案
散点图・拟合模型与残差挑战
The scatterplot shows the relationship between two variables, t and d.
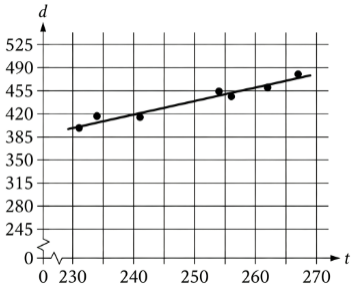
Which of the following equations is the most appropriate linear model for the data shown?
Which of the following equations is the most appropriate linear model for the data shown?
参考答案
散点图・拟合模型与残差基础
The scatterplot shows the relationship between x and y. A line of best fit is also shown.
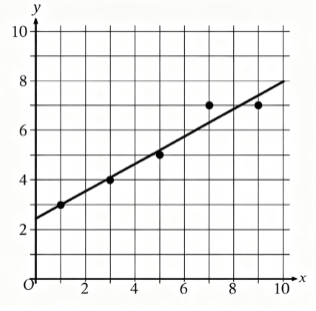
Which of the following is closest to the slope of this line of best fit?
Which of the following is closest to the slope of this line of best fit?
参考答案
散点图・拟合模型与残差挑战
The scatterplot shows the relationship between two variables, x and y. A line of best fit is also shown.
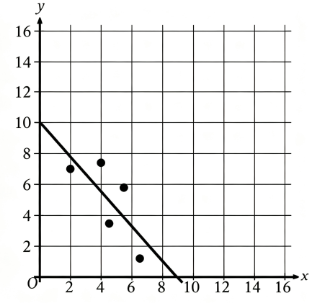
Which of the following is closest to the slope of this line of best fit?
参考答案
散点图・拟合模型与残差进阶

Which of the following equations is the most appropriate model for the data shown?
原库参考解析