
5272道题目5525 条题源记录 · 相同内容已合并
散点图・拟合模型与残差挑战
The scatterplot below shows the amount of electric energy generated, in millions of megawatt-hours, by nuclear sources over a 10‐year period.
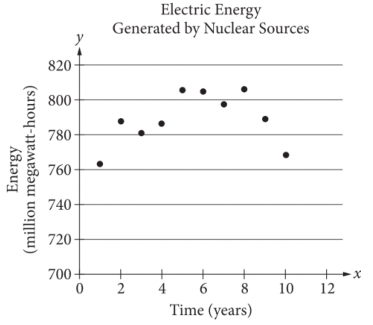
Of the following equations, which best models the data in the scatterplot?
原库参考解析
散点图・拟合模型与残差挑战
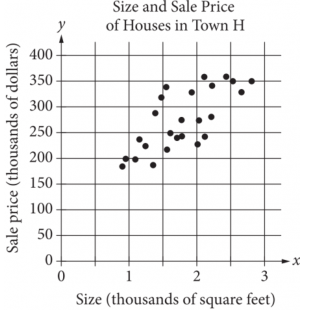
The scatterplot above shows the size x and the sale price y of 25 houses for sale in Town H. Which of the following could be an equation for a line of best fit for the data?
原库参考解析
散点图・拟合模型与残差挑战
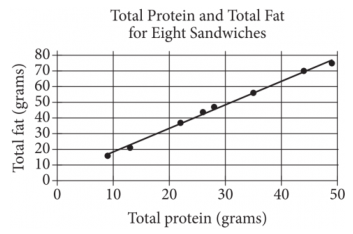
The scatterplot above shows the numbers of grams of both total protein and total fat for eight sandwiches on a restaurant menu. The line of best fit for the data is also shown. According to the line of best fit, which of the following is closest to the predicted increase in total fat, in grams, for every increase of 1 gram in total protein?
原库参考解析
散点图・拟合模型与残差进阶
Which of the following is closest to the slope of this line of best fit?
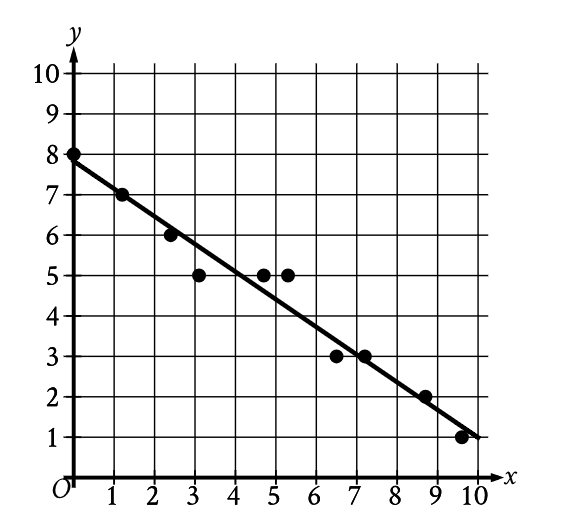
原库参考解析
散点图・拟合模型与残差基础
The scatterplot shows the relationship between the weight, in pounds, of each of 9 female gray wolves on April 30 and the number of offspring each gray wolf produced.
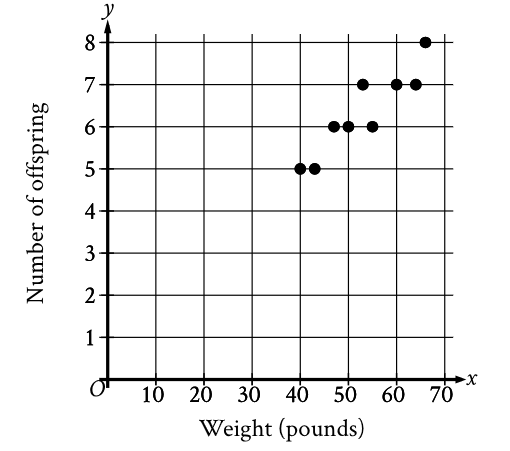
How many offspring did the 50-pound gray wolf produce?
原库参考解析
散点图・拟合模型与残差挑战
An orchard owner recorded the weight, in pounds, of all nectarines that grew on a dwarf nectarine tree during each growing season after the tree's transplantation. The scatterplot shows this weight, in pounds, for each growing season after the tree's transplantation.
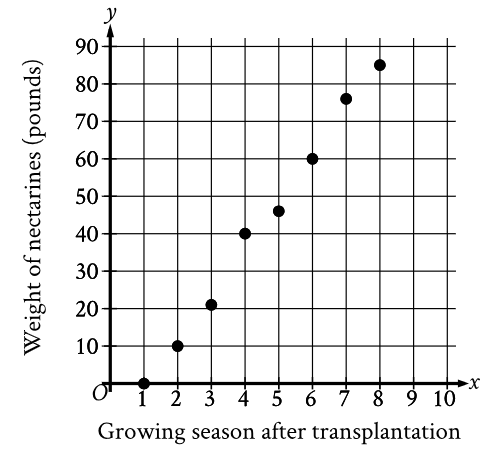
What was the weight, to the nearest pound, of all nectarines that grew on the tree during the 4th growing season after the tree's transplantation?
原库参考解析
散点图・拟合模型与残差进阶
The scatterplot shows the relationship between x and y. A line of best fit is also shown.
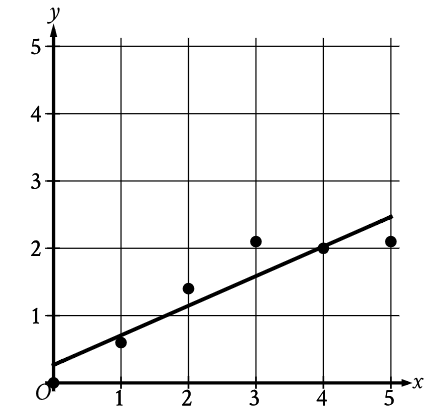
Which of the following is closest to the slope of the line of best fit shown?
原库参考解析
散点图・拟合模型与残差进阶
The scatterplot shows the relationship between two variables, x and y.
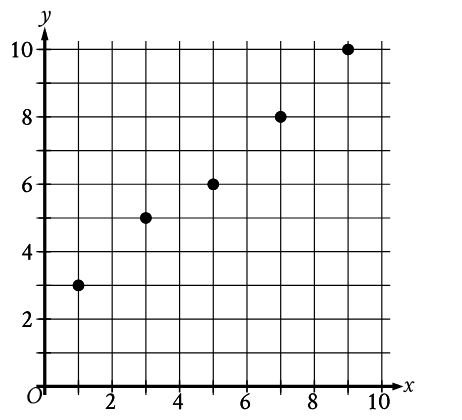
Which equation is the most appropriate linear model for this relationship?
原库参考解析
散点图・拟合模型与残差挑战
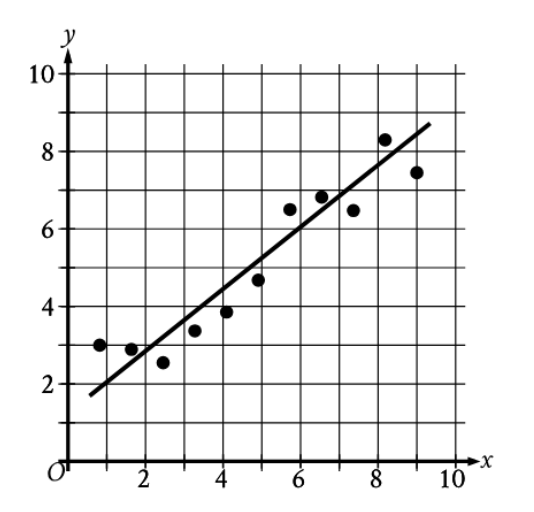
The scatterplot shows the relationship between two variables, x and y. A line of best fit is also shown. For how many of the 11 data points does the line of best fit predict a greater y-value than the actual y-value?
原库参考解析
散点图・拟合模型与残差进阶
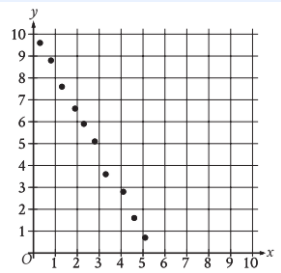
Which of the following equations is the most appropriate linear model for the data shown in the scatterplot?
原库参考解析
散点图・拟合模型与残差挑战
The scatterplot shows the relationship between two variables, x and y. A line of best fit is also shown.
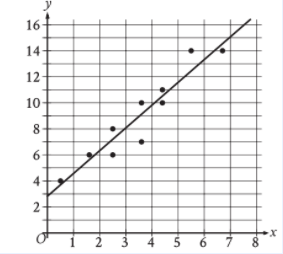
Which of the following equations best represents the line of best fit shown?
原库参考解析
散点图・拟合模型与残差挑战
The scatterplot shows the relationship between two variables, x and y. A line of best fit is also shown.
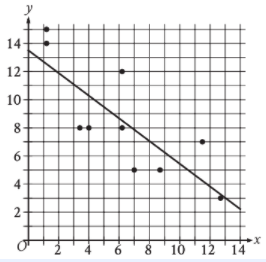
Which of the following equations best represents the line of best fit shown?
原库参考解析