
5272道题目5525 条题源记录 · 相同内容已合并
散点图・拟合模型与残差基础
The scatterplot shows the relationship between two variables, x and y. A line of best fit is also shown.
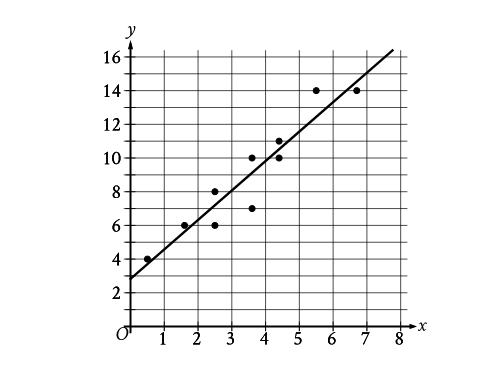
Which of the following equations best represents the line of best fit shown?
原库参考解析
散点图・拟合模型与残差挑战
The scatterplot shows the relationship between two variables, x and y. A line of best fit is also shown.
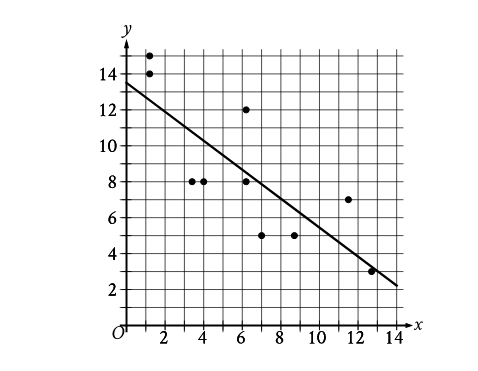
Which of the following equations best represents the line of best fit shown?
原库参考解析
散点图・拟合模型与残差挑战
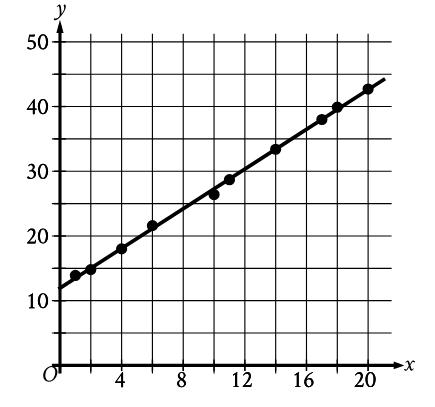
The scatterplot shows the relationship between two variables, x and y, for data set E. A line of best fit is shown. Data set F is created by multiplying the y-coordinate of each data point from data set E by 3.9. Which of the following could be an equation of a line of best fit for data set F?
原库参考解析
散点图・拟合模型与残差进阶
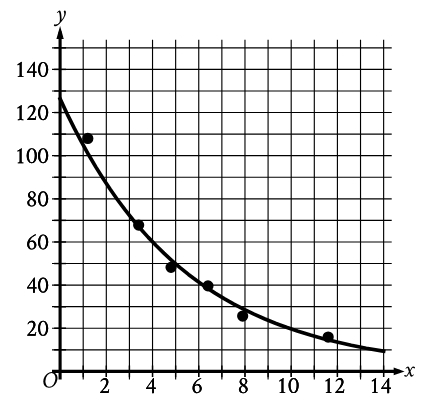
The scatterplot shows the relationship between two variables, x and y. An equation for the exponential model shown can be written as \( y=a\left(b\right)^x \) , where a and b are positive constants.Which of the following is closest to the value of b?
原库参考解析
散点图・拟合模型与残差进阶
During a study, the temperature, in degrees Celsius (°C), of the air in a chamber was recorded to the nearest integer at certain times. The scatterplot shows the recorded temperature y, in °C, of the air in the chamber x minutes after the start of the study.
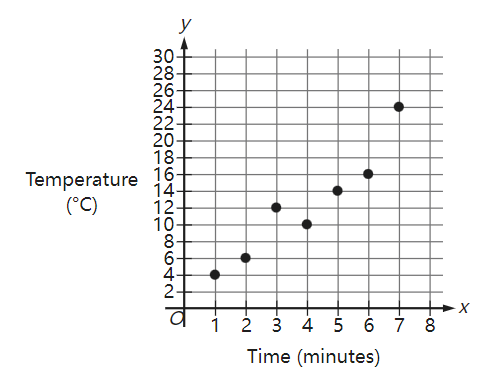
What was the average rate of change, in °C per minute, of the recorded temperature of the air in the chamber from\( x=5 \) to \( x=7 \) ?
原库参考解析
散点图・拟合模型与残差基础
The scatterplot shows the temperature, in degrees Fahrenheit (°F), and the distance above sea level, in feet measured at 6 locations on Mount Jefferson. A line of best fit is also shown.
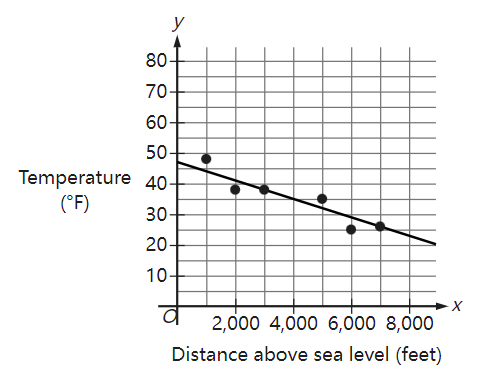
At a distance of 4,000 feet above sea level, what is the temperature, in °F, predicted by the line of best fit?
原库参考解析
散点图・拟合模型与残差挑战
In the given scatterplot, a line of best fit for the data is shown.
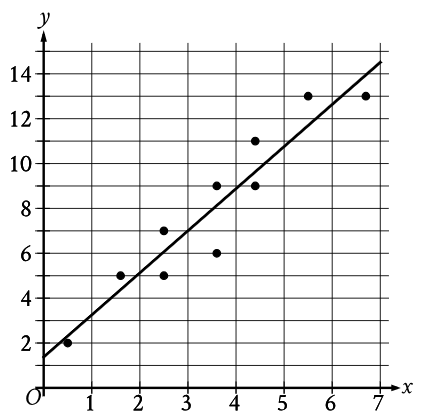
Which of the following is closest to the slope of the line of best fit shown?
原库参考解析
散点图・拟合模型与残差进阶
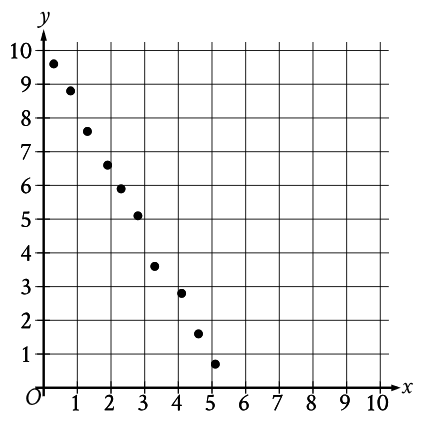
Which of the following equations is the most appropriate linear model for the data shown in the scatterplot?
原库参考解析
散点图・拟合模型与残差挑战
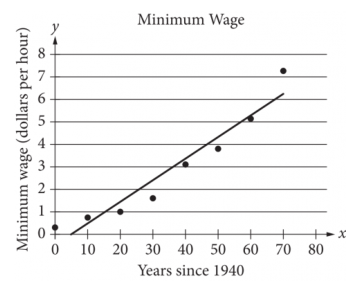
The scatterplot above shows the federal-mandated minimum wage every 10 years between 1940 and 2010. A line of best fit is shown, and its equation is y =0.096x - 0.488. What does the line of best fit predict about the increase in the minimum wage over the 70-year period?
原库参考解析
散点图・拟合模型与残差挑战
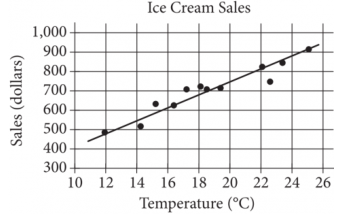
The scatterplot above shows a company’s ice cream sales d, in dollars, and the high temperature t, in degrees Celsius (°C), on 12 different days. A line of best fit for the data is also shown. Which of the following could be an equation of the line of best fit?
原库参考解析
散点图・拟合模型与残差挑战
The scatterplot shows the relationship between the length of time y , in hours, a certain bird spent in flight and the number of days after January 11, x .
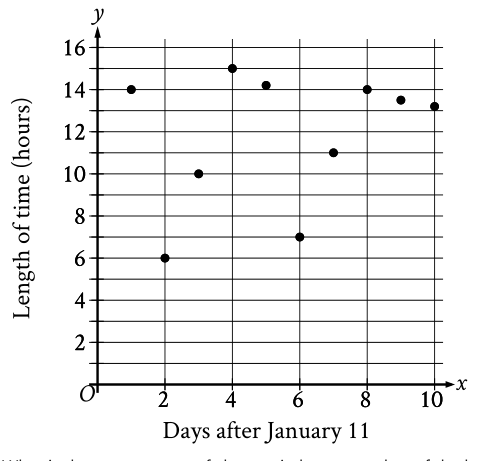
What is the average rate of change, in hours per day, of the length of time the bird spent in flight on January 13 to the length of time the bird spent in flight on January 15?
原库参考解析
散点图・拟合模型与残差挑战
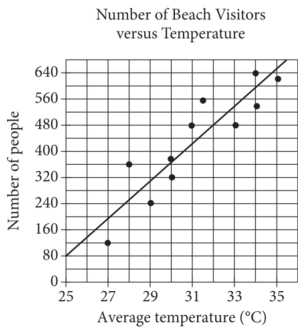
Each dot in the scatterplot above represents the temperature and the number of people who visited a beach in Lagos, Nigeria, on one of eleven different days. The line of best fit for the data is also shown. The line of best fit for the data has a slope of approximately 57. According to this estimate, how many additional people per day are predicted to visit the beach for each 5°C increase in average temperature?
原库参考解析