
ONE QUESTION, ONE STEP
ZX-35A3FF2288PSAT10 P2 · 第 1 题
PSAT10 P2 · 原库模块 2 · Q1 原库参考解析
The bar graph shows the distribution of the number of walnuts per container for 20 containers at a grocery store.
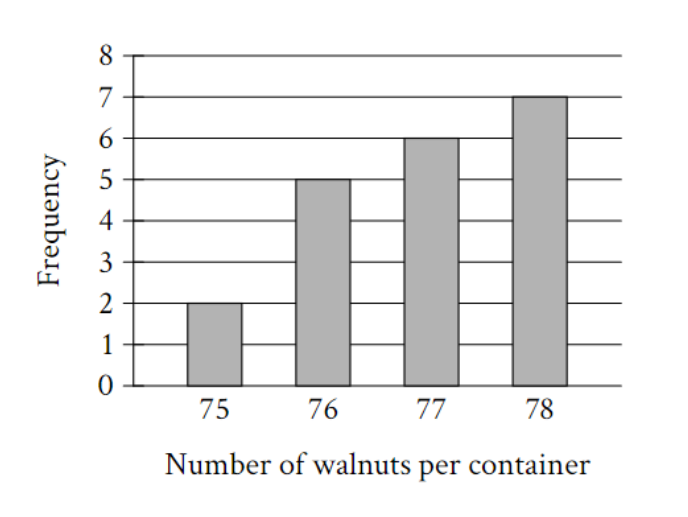
How many of these containers of walnuts contain exactly 78 walnuts?
参考答案:
解题思路
容易忽略的一步

