
ONE QUESTION, ONE STEP
ZX-4F1B73CD3BBluebook试题7 · 第 6 题
Bluebook试题7 · 原库模块 1 · Q6 原库参考解析
During the first part of an experiment, a ball was launched from a 7-foot-tall platform. The graph shows the height y, in feet, of the ball x seconds after it was launched during the first part of the experiment.
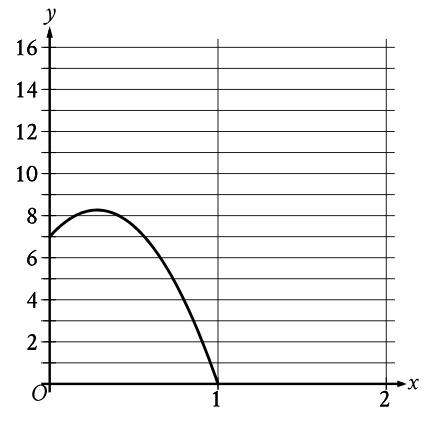
During the second part of the experiment, the ball was launched the same way, but from a platform that is 2 feet shorter than the first platform. Which of the following graphs could represent the height y, in feet, of the ball x seconds after it was launched during the second part of the experiment?
参考答案:
解题思路
容易忽略的一步

