
这部分需要会什么?
- 从图象读取定义域、值域、截距和增减区间
- 解释水平与竖直平移
- 理解伸缩和反射如何改变图象上的点
核心概念与公式
\(y=f(x-h)+k\) 把原图象向右平移 \(h\)、向上平移 \(k\);负值表示反方向。若原图象上有 \((a,b)\),新图象上就有 \((a+h,b+k)\)。
\(y=Af(x)\) 将纵坐标乘 \(A\),\(A<0\) 时还关于横轴反射;\(y=f(Bx)\)(\(B\ne0\))将横坐标除以 \(B\),\(B<0\) 时还关于纵轴反射。定义域看横坐标范围,值域看纵坐标范围;实心点包含端点,空心点不包含。
做题时怎样使用
- 先从图象找可靠的关键点,如顶点、端点和截距
- 水平变化看函数括号里面,竖直变化看外面
- 使用点的坐标变化验证方向,再读取需要的函数特征
容易混淆的地方
\(f(x+3)\) 是向左 3,不是向右 3。函数值为正和函数递增是不同概念:一个看位置,一个看变化趋势。
用一个例题串起方法
知识点教学例题\(f\) 的图象经过 \((2,5)\)。\(g(x)=f(x-3)-4\) 的图象必经过哪个对应点?
展开解题思路 +
新图象向右 3、向下 4,因此对应点为 \((2+3,5-4)=(5,1)\)。代入检验:\(g(5)=f(2)-4=1\)。
本知识点题库
先独立作答,再查看答案与解析。
函数图象・平移与特征基础
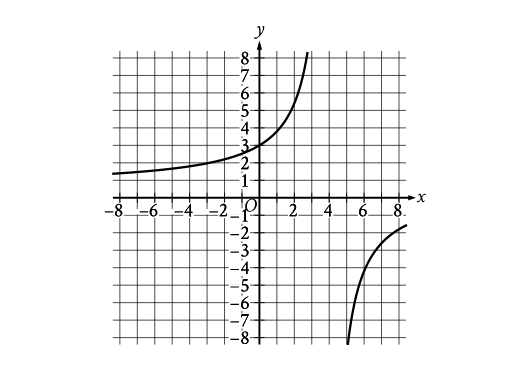
The graph of y = f(x) is shown in the xy-plane. What is the value of f(0)?
原库参考解析
函数图象・平移与特征挑战
The rational function \(f\) is defined by an equation in the form \(f(x)=\frac{a}{x+b}\), where \(a\) and \(b\) are constants. The partial graph of \(y=f(x)\) is shown. If \(g(x)=f(x+4)\), which equation could define function \(g\)?
原库参考解析
函数图象・平移与特征进阶
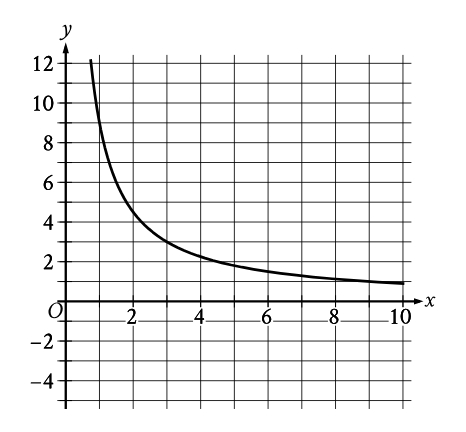
The graph of the rational function f is shown, where y= f(x) and x \( \ge \)0. Which of the following is the graph of y= f(x)+5, where x \( \ge \)0?
原库参考解析
函数图象・平移与特征挑战
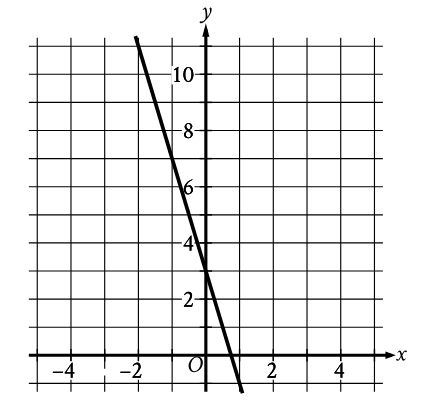
The graph of the linear function y= f(x)+ 19 is shown. If c and d are positive constants, which equation could define f?
原库参考解析
函数图象・平移与特征基础
The graph of function f is shown, where y = f(x).
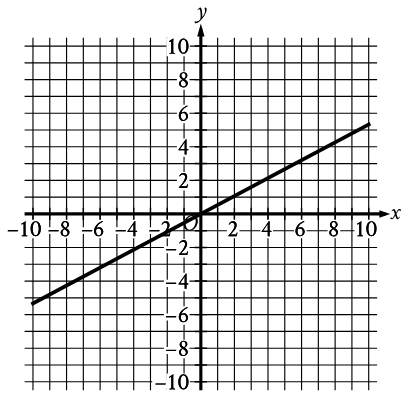
Which of the following describes function f ?
原库参考解析
函数图象・平移与特征基础
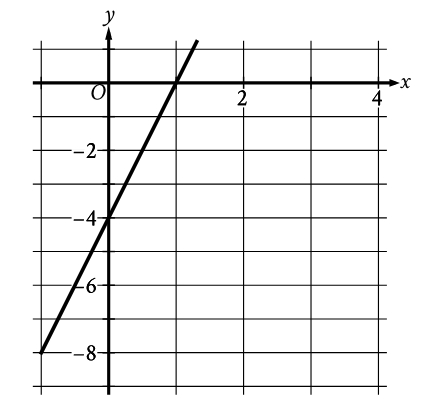
The graph of the function f is shown, where y=f(x). What is the y-intercept of the graph?
原库参考解析
函数图象・平移与特征进阶
During the first part of an experiment, a ball was launched from a 7-foot-tall platform. The graph shows the height y, in feet, of the ball x seconds after it was launched during the first part of the experiment.
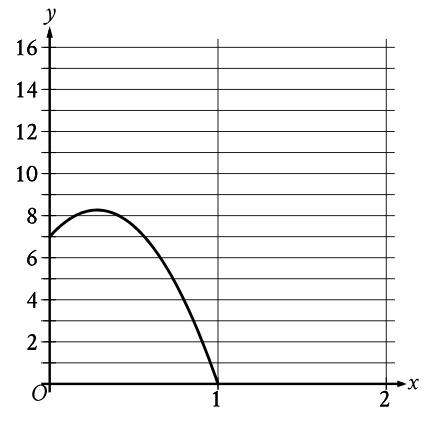
During the second part of the experiment, the ball was launched the same way, but from a platform that is 2 feet shorter than the first platform. Which of the following graphs could represent the height y, in feet, of the ball x seconds after it was launched during the second part of the experiment?
原库参考解析
函数图象・平移与特征挑战
\( f\left(x\right)=\left(x+6\right)\left(x+5\right)\left(x-4\right) \)
The function \( f \) is given. Which table of values represents \( y=f\left(x\right)-3 \)?
原库参考解析
函数图象・平移与特征进阶
The function \( f \) is defined by \( f\left(x\right)=\left(x-6\right)\left(x-2\right)\left(x+6\right) \). In the xy-plane, the graph of \( y=g\left(x\right) \) is the result of translating the graph of \( y=f\left(x\right) \) up 4 units. What is the value of \( g\left(0\right) \)?
原库参考解析
函数图象・平移与特征挑战
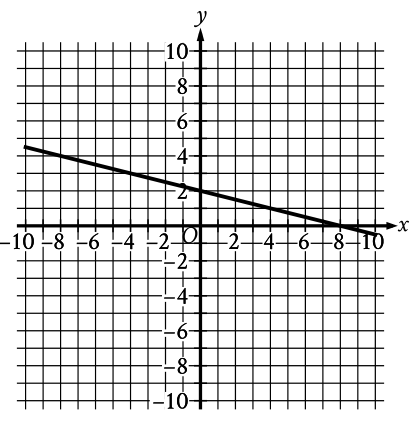
The graph of y = f(x) +14 is shown. Which equation defines function f ?
原库参考解析
函数图象・平移与特征挑战
The functions f and g are defined as \( f\left(x\right)=\frac{1}{4}x-9 \) and \( g\left(x\right)=\frac{3}{4}x+21 \). If the function h is defined as h(x) = f(x) + g(x) , what is the x-coordinate of the x-intercept of the graph of y = h(x) in the xy-plane?
原库参考解析
函数图象・平移与特征进阶
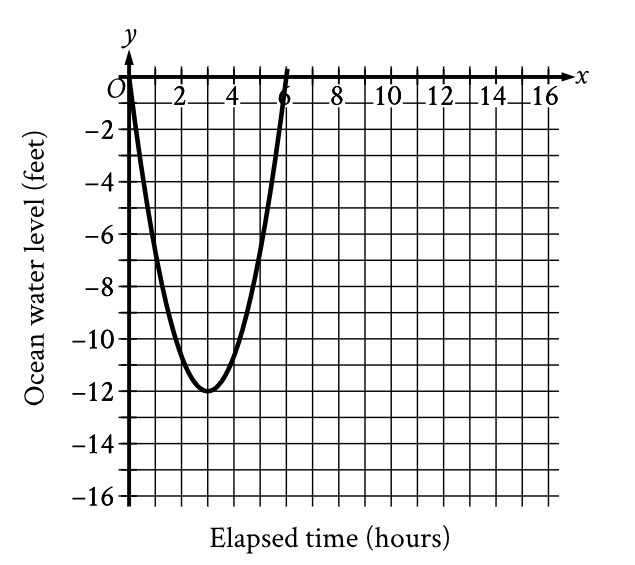
Scientists recorded data about the ocean water levels at a certain location over a period of 6 hours. The graph shown models the data, where y =0 represents sea level. Which table gives values of x and their corresponding values of y based on the model?
原库参考解析

