
ONE QUESTION, ONE STEP
ZX-4F4CA86991Models and scatterplots · 第 3 题
Models and scatterplots · 原库模块 1 · Q3 原库参考解析
The scatterplot shows the relationship between the length of time y , in hours, a certain bird spent in flight and the number of days after January 11, x .
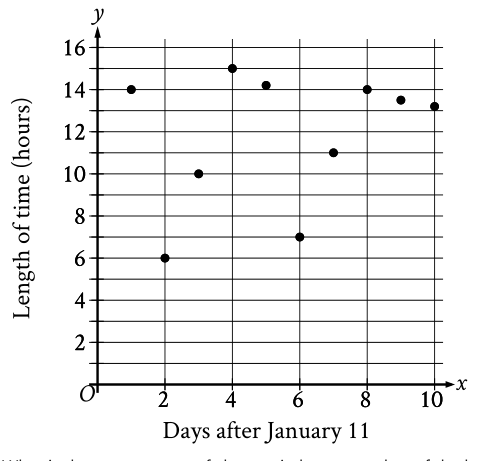
What is the average rate of change, in hours per day, of the length of time the bird spent in flight on January 13 to the length of time the bird spent in flight on January 15?
参考答案:
解题思路
容易忽略的一步

