
ONE QUESTION, ONE STEP
ZX-6D78D7119BPSAT 8/9 P1 · 第 12 题
PSAT 8/9 P1 · 原库模块 1 · Q12 原库参考解析
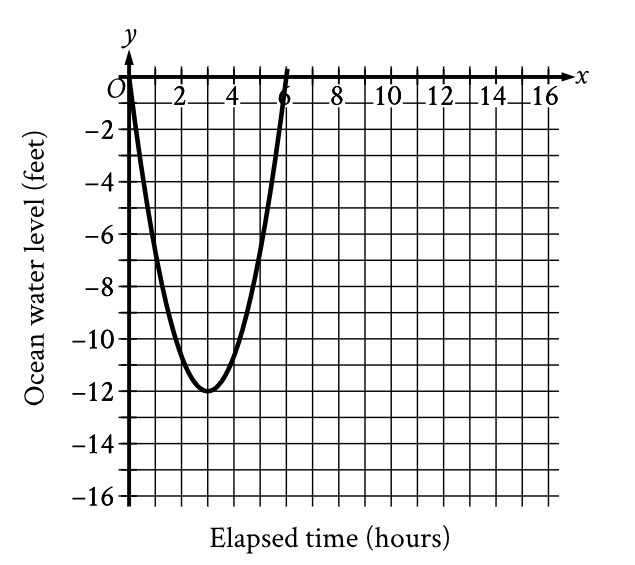
Scientists recorded data about the ocean water levels at a certain location over a period of 6 hours. The graph shown models the data, where y =0 represents sea level. Which table gives values of x and their corresponding values of y based on the model?
参考答案:
解题思路
容易忽略的一步

