
ONE QUESTION, ONE STEP
ZX-6FEB08E946Models and scatterplots · 第 5 题
Models and scatterplots · 原库模块 1 · Q5 原库参考解析
The scatterplot below shows the amount of electric energy generated, in millions of megawatt-hours, by nuclear sources over a 10‐year period.
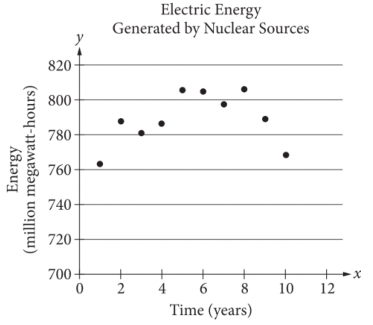
Of the following equations, which best models the data in the scatterplot?
参考答案:
解题思路
容易忽略的一步

