
ONE QUESTION, ONE STEP
ZX-7D5A346E01Models and scatterplots · 第 7 题
Models and scatterplots · 原库模块 1 · Q7 原库参考解析
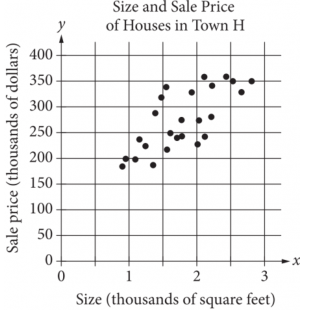
The scatterplot above shows the size x and the sale price y of 25 houses for sale in Town H. Which of the following could be an equation for a line of best fit for the data?
参考答案:
解题思路
容易忽略的一步

