
ONE QUESTION, ONE STEP
ZX-8FE9558EBDBluebook试题7 · 第 3 题
Bluebook试题7 · 原库模块 1 · Q3 原库参考解析
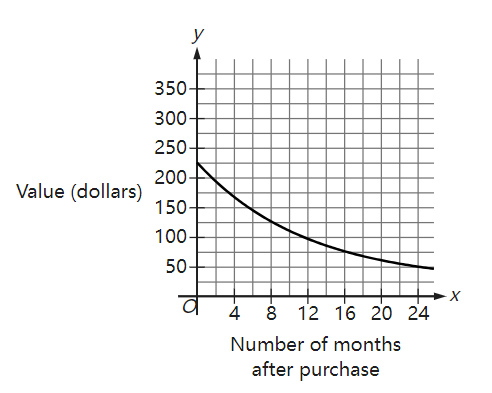
The graph shown gives the estimated value, in dollars, of a tablet as a function of the number of months since it was purchased. What is the best interpretation of the y-intercept of the graph in this context?
参考答案:
解题思路
容易忽略的一步

