
ONE QUESTION, ONE STEP
ZX-95EA36EB64Models and scatterplots · 第 4 题
Models and scatterplots · 原库模块 1 · Q4 原库参考解析
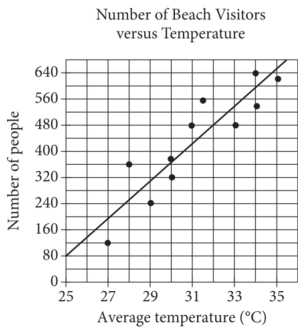
Each dot in the scatterplot above represents the temperature and the number of people who visited a beach in Lagos, Nigeria, on one of eleven different days. The line of best fit for the data is also shown. The line of best fit for the data has a slope of approximately 57. According to this estimate, how many additional people per day are predicted to visit the beach for each 5°C increase in average temperature?
参考答案:
解题思路
容易忽略的一步

