
ONE QUESTION, ONE STEP
ZX-BEFA4BE619Models and scatterplots · 第 9 题
Models and scatterplots · 原库模块 1 · Q9 原库参考解析
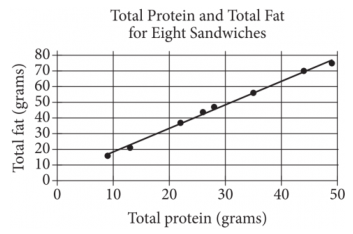
The scatterplot above shows the numbers of grams of both total protein and total fat for eight sandwiches on a restaurant menu. The line of best fit for the data is also shown. According to the line of best fit, which of the following is closest to the predicted increase in total fat, in grams, for every increase of 1 gram in total protein?
参考答案:
解题思路
容易忽略的一步

