
ONE QUESTION, ONE STEP
ZX-CD568680BF机考OG4 · 第 22 题
机考OG4 · 原库模块 2 · Q22 原库参考解析
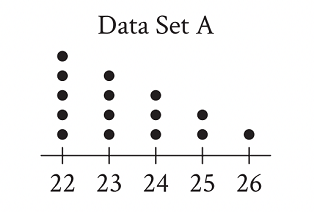
The dot plot represents the 15 values in data set A. Data set B is created by adding 56 to each of the values in data set A. Which of the following correctly compares the medians and the ranges of data sets A and B?
参考答案:
解题思路
容易忽略的一步

