
ONE QUESTION, ONE STEP
ZX-CF1FCF0BB9PSAT 8/9 P2 · 第 1 题
PSAT 8/9 P2 · 原库模块 1 · Q1 原库参考解析
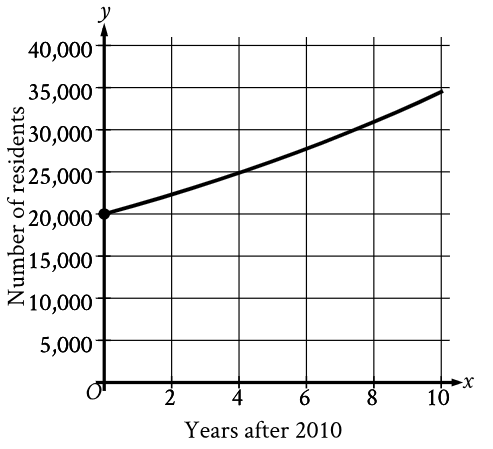
The graph shown models the number of residents of a certain city x years after 2010. How many residents does this model estimate the city had in 2010?
参考答案:
解题思路
容易忽略的一步

