
这部分需要会什么?
- 区分总体、样本和样本统计量
- 理解随机抽样与随机分组各自支持的结论
- 解释误差范围并识别样本偏差
核心概念与公式
总体是希望研究的全体对象,样本是实际观测的一部分。随机抽样有助于把结果推广到所抽取的总体;随机分配处理的设计良好的对照实验,有助于判断处理造成的因果影响。这两种随机化用途不同。
估计值加减误差范围构成报告区间,例如 52% ± 3 个百分点给出 49% 至 55%。相同抽样方式和置信水平下,样本量增大通常减小抽样误差;常见情况下误差范围约与样本量平方根成反比。
做题时怎样使用
- 先确定研究希望推广到谁,以及样本实际上来自谁
- 检查随机抽样、非应答和自愿参与等因素
- 只作研究设计支持的结论,读清误差范围的单位与置信条件
容易混淆的地方
样本很大不能自动消除抽样偏差。观察到相关关系不能直接断言因果;误差区间也不是对总体参数位置的绝对保证。
用一个例题串起方法
知识点教学例题从某校全体学生中随机抽取 400 人,估计支持某方案的比例为 58%,误差范围为 4 个百分点。报告区间是什么,能直接推广到全国学生吗?
展开解题思路 +
报告区间为 \(58\%-4\%=54\%\) 至 \(58\%+4\%=62\%\)。样本来自这一所学校,推断范围应对应这所学校的学生,不能直接推广到全国学生。
本知识点题库
先独立作答,再查看答案与解析。
抽样・推断与误差范围挑战
A trivia tournament organizer wanted to study the relationship between the number of points a team scores in a trivia round and the number of hours that a team practices each week. For the study, the organizer selected 55 teams at random from all trivia teams in a certain tournament. The table displays the information for the 40 teams in the sample that practiced for at least 3 hours per week.
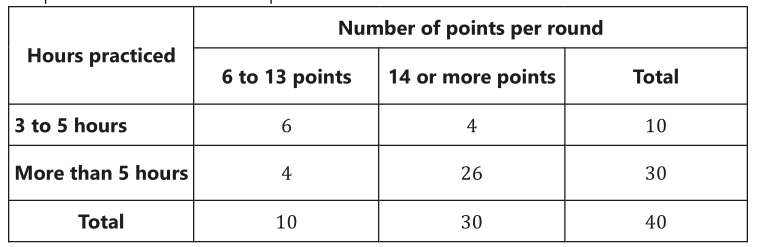
Which of the following is the largest population to which the results of the study can be generalized?
原库参考解析
抽样・推断与误差范围挑战
A psychologist designed and conducted a study to determine whether playing a certain educational game increases middle school students’ accuracy in adding fractions. For the study, the psychologist chose a random sample of 35 students from all of the students at one of the middle schools in a large city. The psychologist found that students who played the game showed significant improvement in accuracy when adding fractions. What is the largest group to which the results of the study can be generalized?
原库参考解析
抽样・推断与误差范围挑战
Near the end of a US cable news show, the host invited viewers to respond to a poll on the show’s website that asked, “Do you support the new federal policy discussed during the show?” At the end of the show, the host reported that 28% responded “Yes,” and 70% responded “No.” Which of the following best explains why the results are unlikely to represent the sentiments of the population of the United States?
原库参考解析
抽样・推断与误差范围挑战
To determine the mean number of children per household in a community, Tabitha surveyed 20 families at a playground. For the 20 families surveyed, the mean number of children per household was 2.4. Which of the following statements must be true?
原库参考解析
抽样・推断与误差范围挑战
According to the 2010 Census, the adult population aged 18 years or greater of the United States in 2010 was 234,564,071. In 2010, a survey was conducted among a randomly chosen sample of adults aged 18 years or greater in the United States about their preference to live in a warm climate or a cool climate. The table below displays a summary of the survey results.
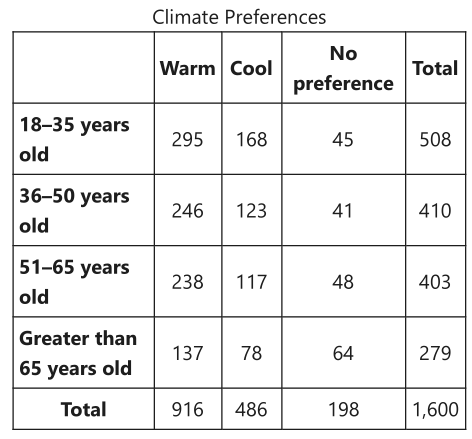
Which of the following is closest to the difference between the percentage of adults aged 18–50 years who responded “warm” and the percentage of adults aged 51 years or greater who responded “warm”?
原库参考解析
抽样・推断与误差范围挑战
Based on a random sample from a population, a researcher estimated that the mean value of a certain variable for the population is 20.5, with an associated margin of error of 1. Which of the following is the most appropriate conclusion?
原库参考解析

