
5272道题目5525 条题源记录 · 相同内容已合并
分布图表・极差与标准差进阶
The table shows the frequency of values in a data set.
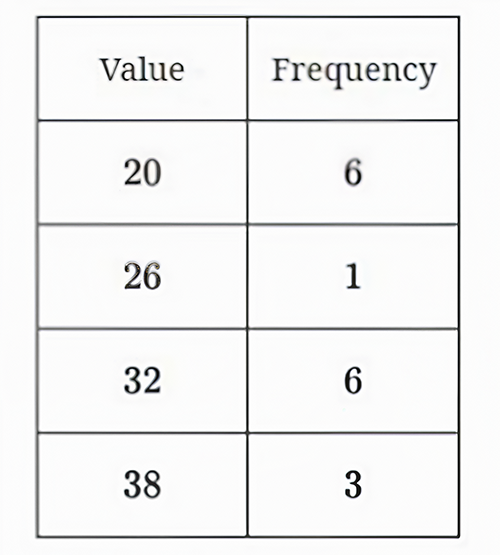
What is the minimum value of the data set?
原库参考解析
分布图表・极差与标准差挑战
The dot plots represent the distributions of values in data sets A and B.

Which of the following statements must be true?
Ⅰ. The median of data set A is equal to the median of data set B.
Ⅱ. The standard deviation of data set A is equal to the standard deviation of data set B.
原库参考解析
分布图表・极差与标准差进阶
Data set A: 8, 11, 12, 15, 21, 27
Data set B: 9, 12, 13, 16, 22, h
Data sets A and B each consist of 6 values as shown, where h is a constant. If the standard deviation of data set A is greater than the standard deviation of data set B, which of the following could be the value of h?
Ⅰ. 23
Ⅱ. 28
Ⅲ. 29
原库参考解析
分布图表・极差与标准差进阶
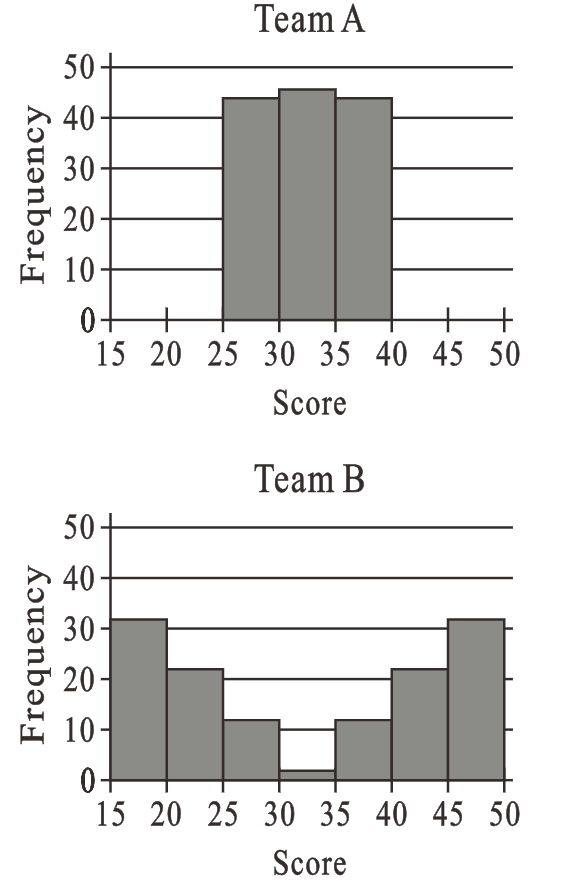
The histograms summarize the distributions of scores for team A and team B. Which statement best compares the standard deviations of scores for these teams?
原库参考解析
分布图表・极差与标准差挑战
The weight of each object in two groups, A and B, was recorded. The histograms represent the distributions of weight, in grams, for the objects in groups A and B.
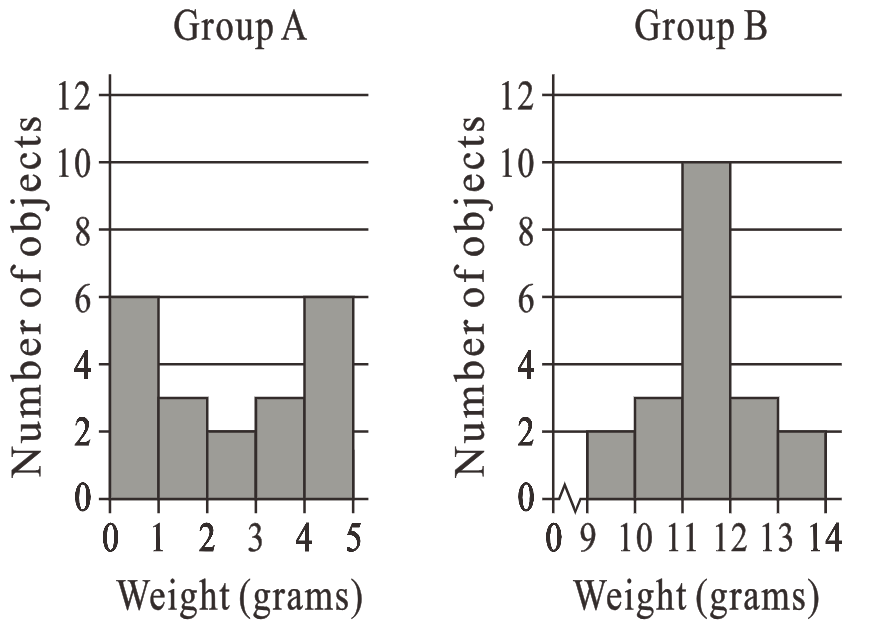
The mean weight of the objects in group A is equal to 2.1, and the mean weight of the objects in group B is equal to 11.1. Which of the following statements about the standard deviations of weight for the objects in these two groups is true?
原库参考解析
分布图表・极差与标准差进阶
The dot plots represent the distributions of values in data sets A and B.
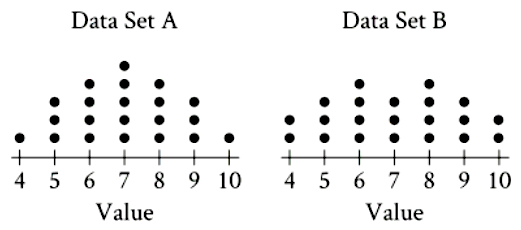
Which of the following statements must be true?
I. The median of data set A is equal to the median of data set B.
II. The standard deviation of data set A is equal to the standard deviation of data set B.
原库参考解析
分布图表・极差与标准差挑战
Which of the following lists represents a data set with the smallest standard deviation?
原库参考解析
分布图表・极差与标准差进阶
The bar graph shows the distribution of the number of raspberries per carton for 18 cartons of raspberries at a grocery store.
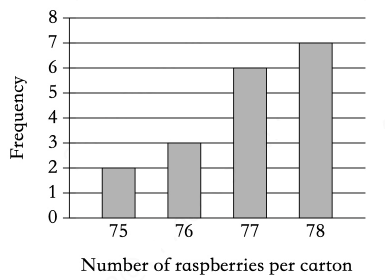
How many of these cartons of raspberries contain exactly 78 raspberries?
原库参考解析
分布图表・极差与标准差进阶
4, 4, 12, 25, 25
What is the range of the data set shown?
原库参考解析
分布图表・极差与标准差进阶
The values in data sets X and Y are shown in the table.

The standard deviation of data set X is q, and the standard deviation of data set Y is s. Which of the following statements about the standard deviation of the data sets is true?
原库参考解析
分布图表・极差与标准差基础
The table summarizes the distribution of average pitching speed, in miles per hour (mph), for a sample of 24 pitchers in a youth softball league.
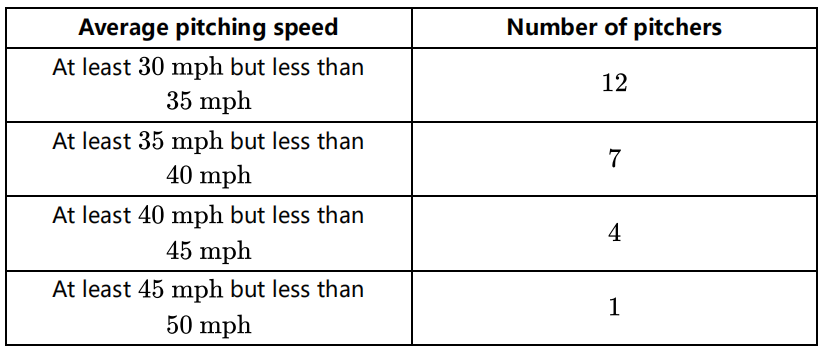
According to the table, how many pitchers in the sample have an average pitching speed of at least 30 mph but less than 35 mph?
原库参考解析
分布图表・极差与标准差挑战
A zoologist observed the nests of wood ducks in an area. Each year, the zoologist recorded the number of eggs in each of the first 35 nests that were observed and created a frequency table for the data set. Which of the following frequency tables represents the data set with the smallest standard deviation?
原库参考解析