
5272道题目5525 条题源记录 · 相同内容已合并
散点图・拟合模型与残差挑战
During an experiment, the temperature, in degrees Celsius (ºC), of a mixture was recorded to the nearest integer at certain times. The scatterplot shows the recorded temperature y , in ºC, of the mixture x hours after the start of the experiment.

What was the average rate of change of the recorded temperature of the mixture over time, in ºC per hour, from x = 1 to x = 3?
原库参考解析
散点图・拟合模型与残差挑战
The scatterplot shows the relationship between two variables, x and y.

Which of the following equations is the most appropriate linear model for the data shown?
原库参考解析
散点图・拟合模型与残差挑战
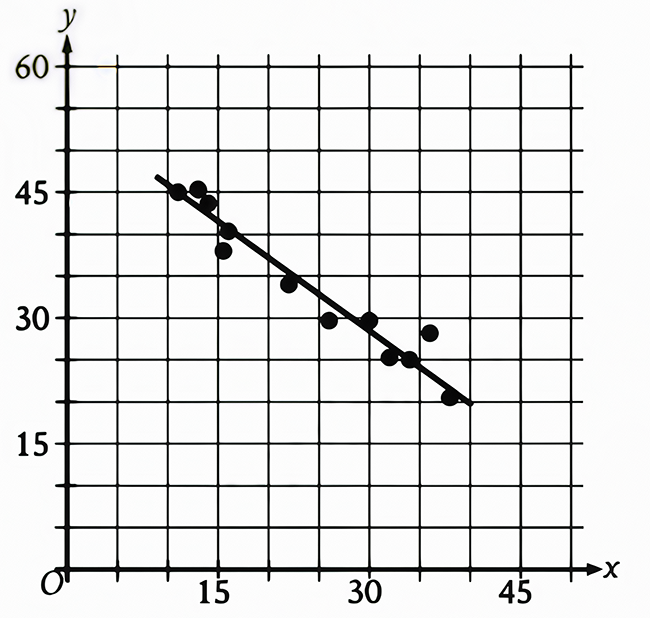
The scatterplot shows the relationship between two variables, x and y, for data set A. A line of best fit for the data is also shown. Data set B is created by subtracting 11 units from the value of y for each data point from data set A. Which of the following is closest to the y-coordinate of the y-intercept of the line of best fit for data set B?
原库参考解析
散点图・拟合模型与残差进阶
The scatterplot shows the relationship between two variables, x and y. A line of best fit is also shown.
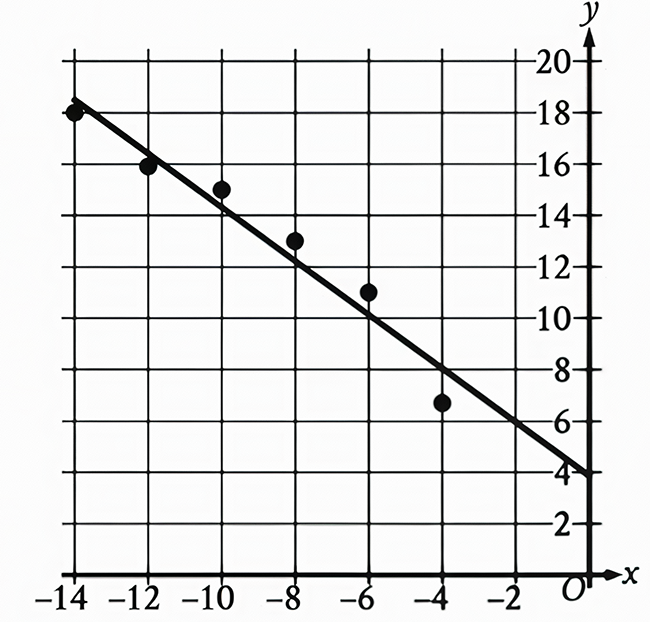
Which of the following equations best represents the line of best fit shown?
原库参考解析
散点图・拟合模型与残差挑战

The scatterplot shows the relationship between two variables, x and y, for data set P. A line of best fit for the data is also shown. Data set Q is created by adding 649 units to the value of x for each data point from data set P. Which of the following could be an equation of a line of best fit for data set Q?
原库参考解析
散点图・拟合模型与残差进阶
The scatterplot shows the temperature y, in °F, recorded by a meteorologist at various times x, in days since June 1.

During which of the following time periods did the greatest increase in recorded temperature take place?
原库参考解析
散点图・拟合模型与残差进阶
The scatterplot shows the relationship between two variables, x and y. A line of best fit is also shown.
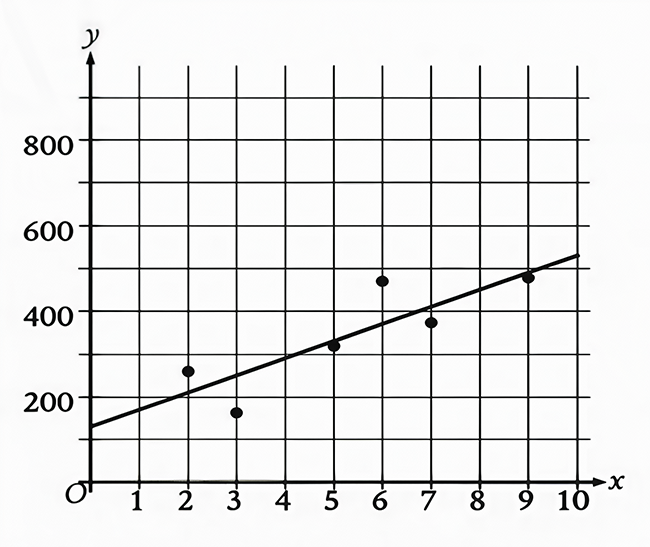
Which of the following best represents the line of best fit shown?
原库参考解析
散点图・拟合模型与残差进阶

The scatterplot shows the relationship between two variables, x and y. An equation for the exponential model shown can be written as \( y=a\left(b\right)^x \). Where a and bare positive tonstants . Which of the following is closes to the value of b ?
原库参考解析
散点图・拟合模型与残差进阶

The scatterplot shows 5 measurements of the body length, in centimeters (cm), of a New Zealand fur seal from an age of 1 year to 6 years old. A line of best fit is also shown. For a New Zealand fur seal at an age of 3 years old, what is the body length predicted by the line of best fit, to the nearest 10 cm?
原库参考解析
散点图・拟合模型与残差进阶

Which of the following is closest to the slope of this line of best fit?
原库参考解析
散点图・拟合模型与残差进阶
The scatterplot shows the relationship between two variables, x and y. A line of best fit is also shown.

Which of the following is closest to the slope of this line of best fit?
原库参考解析
散点图・拟合模型与残差挑战

Which of the following best represents the line of best fit shown?
原库参考解析