
5272道题目5525 条题源记录 · 相同内容已合并
分布图表・极差与标准差进阶
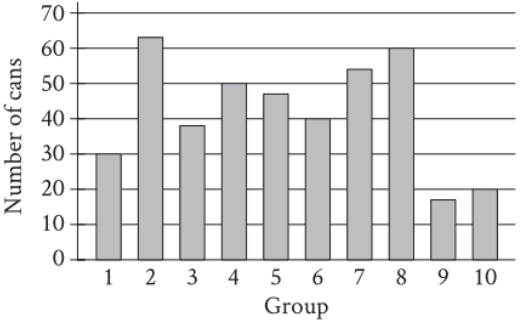
The bar graph shows the distribution of 419 cans collected by 10 different groups for a food drive. How many cans were collected by group 6?
原库参考解析
分布图表・极差与标准差进阶
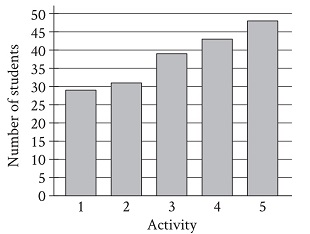
A group of students voted on five after-school activities. The bar graph shows the number of students who voted for each of the five activities. How many students chose activity 3?
原库参考解析
分布图表・极差与标准差挑战
The line graph shows the estimated number of chipmunks in a state park on April 1 of each year from 1989 to 1999.
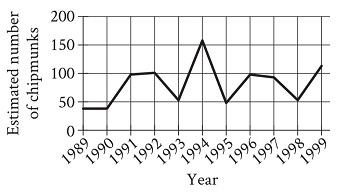
Based on the line graph, in which year was the estimated number of chipmunks in the state park the greatest?
原库参考解析
分布图表・极差与标准差挑战
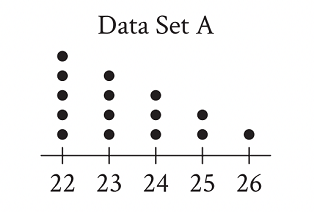
The dot plot represents the 15 values in data set A. Data set B is created by adding 56 to each of the values in data set A. Which of the following correctly compares the medians and the ranges of data sets A and B?
原库参考解析
散点图・拟合模型与残差基础

In the given scatterplot, a line of best fit for the data is shown.
Which of the following is closest to the slope of this line of best fit?
原库参考解析
散点图・拟合模型与残差进阶
The scatterplot shows the relationship between two variables, x and y.

Which of the following equations is the most appropriate linear model for the data shown?
原库参考解析
散点图・拟合模型与残差进阶
The scatterplot shows the relationship between two variables, x and y .

Which of the following equations is the most appropriate linear model for the data shown?
原库参考解析
散点图・拟合模型与残差挑战
The scatterplot shows the relationship between the length of eruption y, in hours, and the number of days after January 11, x, for some eruptions of a certain geyser.
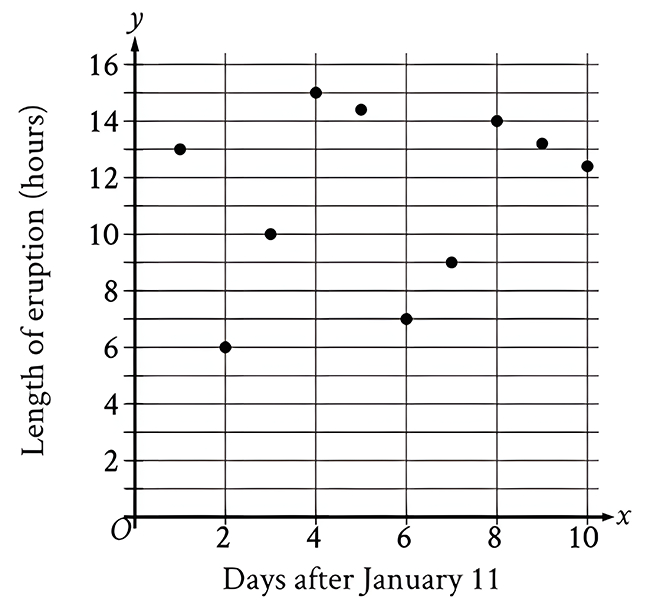
What is the average rate of change, in hours per day, of the length of eruption from the eruption on January 17 to the eruption on January 19?
原库参考解析
散点图・拟合模型与残差进阶
The scatterplot shows the relationship between two variables, x and y.
Which of the following equations is the most appropriate linear model for the data shown?
原库参考解析
散点图・拟合模型与残差进阶
In the given scatterplot, a line of best fit for the data is shown.

Which of the following is closest to the slope of the line of best fit?
原库参考解析
散点图・拟合模型与残差进阶
The scatterplot shows the relationship between two variables, x and y.
Which of the following equations is the most appropriate linear model for the data shown?

原库参考解析
散点图・拟合模型与残差进阶
The scatterplot shows the relationship between two variables, x and y.
Which of the following equations is the most appropriate linear model for the data shown?
原库参考解析