
5272道题目5525 条题源记录 · 相同内容已合并
分布图表・极差与标准差基础
The line graph shows the percent of cars for sale at a used car lot on a given day by model year.
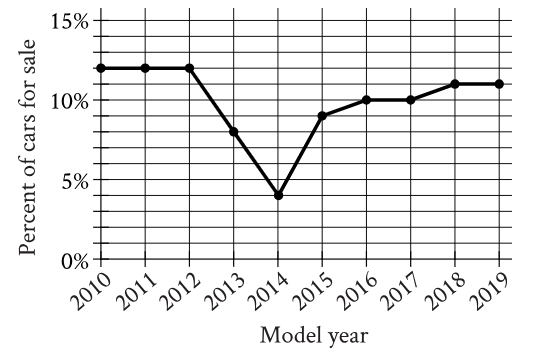
For what model year is the percent of cars for sale the smallest?
原库参考解析
分布图表・极差与标准差进阶
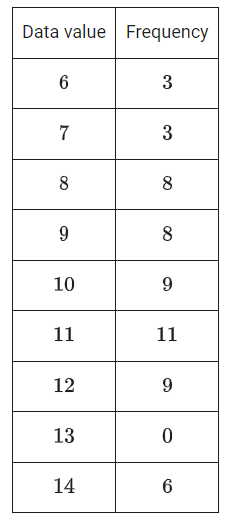
The frequency table summarizes the 57 data values in a data set. What is the maximum data value in the data set?
原库参考解析
分布图表・极差与标准差基础
The bar graph shows the distribution of the number of students in each of four extracurricular activities at a high school.
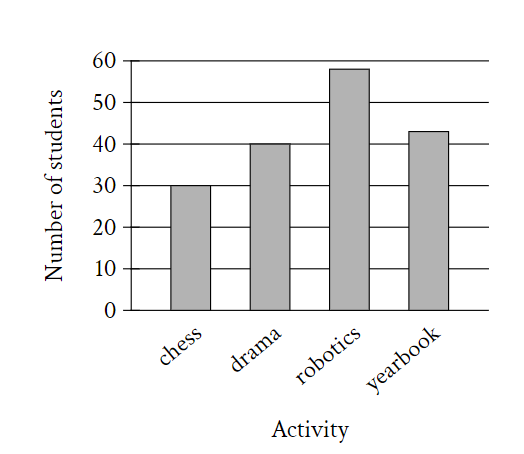
How many more students are in drama than in chess?
原库参考解析
分布图表・极差与标准差挑战
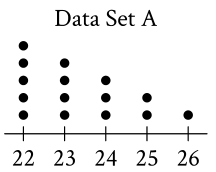
The dot plot represents the 15 values in data set A. Data set B is created by adding 56 to each of the values in data set A. Which of the following correctly compares the medians and the ranges of data sets A and B?
原库参考解析
分布图表・极差与标准差挑战
The dot plots represent the distributions of values in data sets A and B.
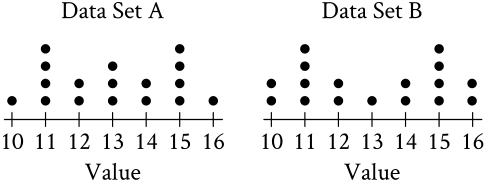
Which of the following statements must be true?
I. The median of data set A is equal to the median of data set B.
II. The standard deviation of data set A is equal to the standard deviation of data set B.
原库参考解析
分布图表・极差与标准差基础
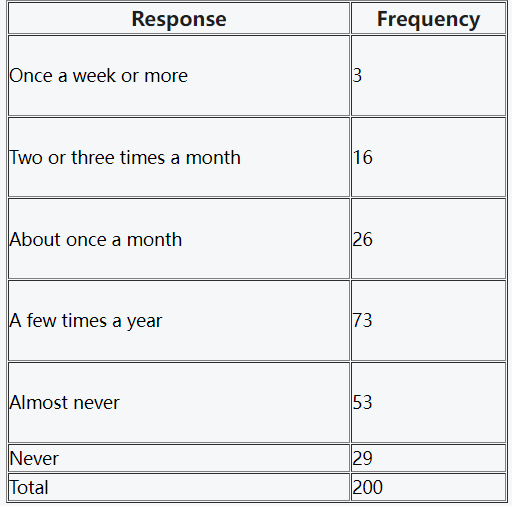
The table gives the results of a survey of 200 people who were asked how often they see a movie in a theater. How many people responded either “never” or “almost never”?
原库参考解析
分布图表・极差与标准差进阶
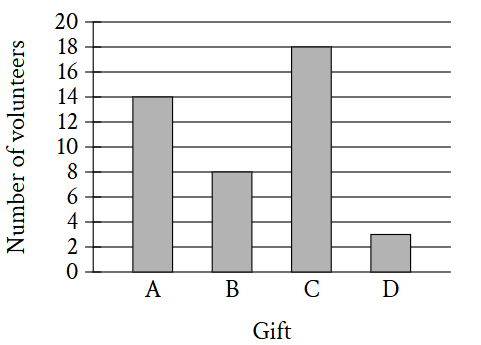
In April, there were 43 volunteers in a cleanup project. Each volunteer was asked to choose a small gift labeled A, B, C, or D. The bar graph shows the number of volunteers who chose each gift. How many volunteers chose gift C?
原库参考解析
分布图表・极差与标准差基础
The bar graph shows the number of each type of monkey in a sanctuary.
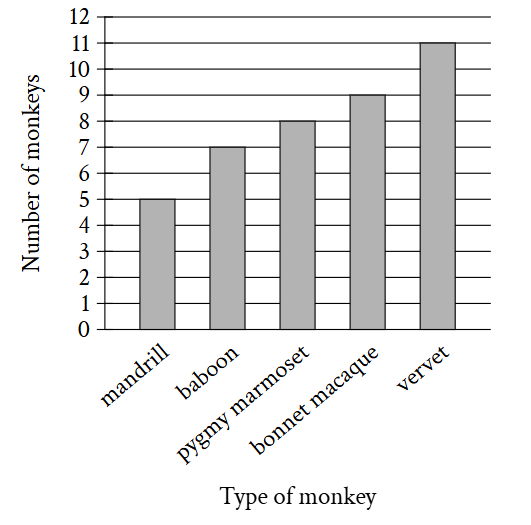
How many more vervets are in this sanctuary than mandrills?
原库参考解析
分布图表・极差与标准差挑战
The table shows the frequency of values in a data set.
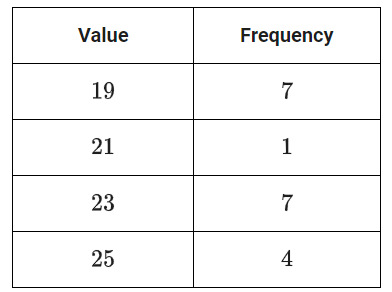
What is the minimum value of the data set?
原库参考解析
分布图表・极差与标准差基础
The bar graph shows the distribution of the number of walnuts per container for 20 containers at a grocery store.
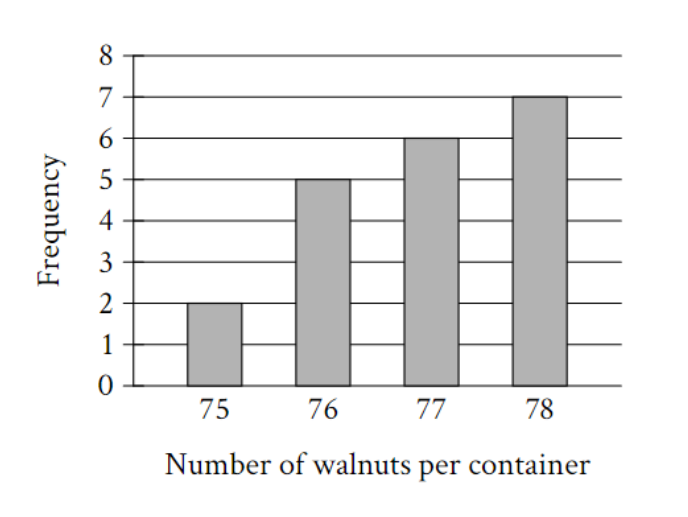
How many of these containers of walnuts contain exactly 78 walnuts?
原库参考解析
分布图表・极差与标准差进阶
| Data value | Frequency |
| 6 | 3 |
| 7 | 3 |
| 8 | 8 |
| 9 | 8 |
| 10 | 9 |
| 11 | 11 |
| 12 | 9 |
| 13 | 0 |
| 14 | 6 |
The frequency table summarizes the 57 data values in a data set. What is the maximum data value in the data set?
原库参考解析
分布图表・极差与标准差进阶
The line graph shows the percent of cars for sale at a used car lot on a given day by model year.
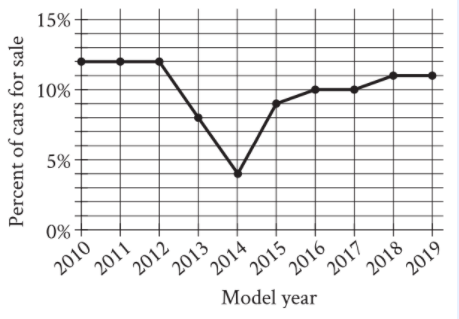
For what model year is the percent of cars for sale the smallest?
原库参考解析