
5272道题目5525 条题源记录 · 相同内容已合并
分布图表・极差与标准差进阶
In each of the following data sets of 5 values, p is a constant. Which of these data sets has the largest standard deviation?
原库参考解析
分布图表・极差与标准差挑战
A zoologist observed the nests of wood ducks in an area. Each year, the zoologist recorded the number of eggs in each of the first 50 nests that were observed and created a frequency table for the data set. Which of the following frequency tables represents the data set with the smallest standard deviation?
原库参考解析
分布图表・极差与标准差进阶
In each of the following data sets of 5 values, p is a constant. Which of these data sets has the largest standard deviation?
参考答案
分布图表・极差与标准差进阶
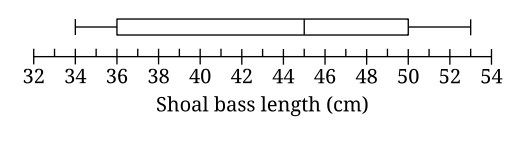
A marine biologist is studying a habitat that contains shoal bass, a species of freshwater fish. The box plot shown summarizes the lengths, in centimeters (cm), of a sample of 75 shoal bass from this habitat. What is the range, in cm, of the lengths of the shoal bass in the sample?
参考答案
分布图表・极差与标准差进阶
The list gives the number of individuals in each of 6 groups of ring-tailed lemurs.
14, 5, 17, 14, 15, 7
What is the range of the numbers of individuals for the 6 groups of ring-tailed lemurs?
参考答案
分布图表・极差与标准差挑战
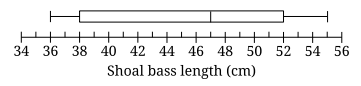
A marine biologist is studying a habitat that contains shoal bass, a species of freshwater fish. The box plot shown summarizes the lengths, in centimeters (cm), of a sample of 75 shoal bass from this habitat. What is the range, in cm, of the lengths of the shoal bass in the sample?
参考答案
分布图表・极差与标准差挑战
The table shown summarizes the distribution of 65 employees based on the number of complete years they have worked at a certain company.
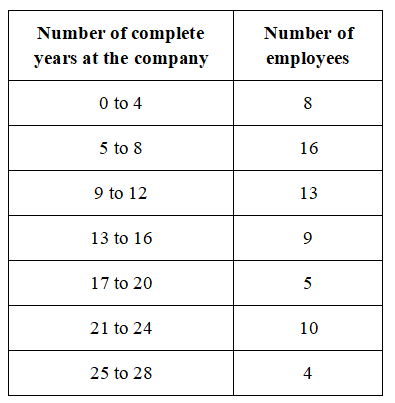
How many of the 65 employees have worked at the company for 21 or more complete years?
How many of the 65 employees have worked at the company for 21 or more complete years?
参考答案
分布图表・极差与标准差挑战
Which of the following lists represents a data set with the smallest standard deviation?
参考答案
分布图表・极差与标准差进阶
The table shown summarizes the distribution of 65 employees based on the number of complete years they have worked at a certain company.
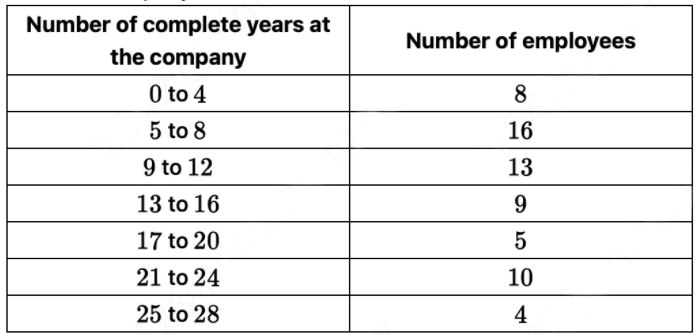
How many of the 65 employees have worked at the company for 21 or more complete years?
原库参考解析
分布图表・极差与标准差进阶
The weight of each object in two groups, A and B, was recorded. The histograms represent the distributions of weight, in grams, for the objects in groups A and B.
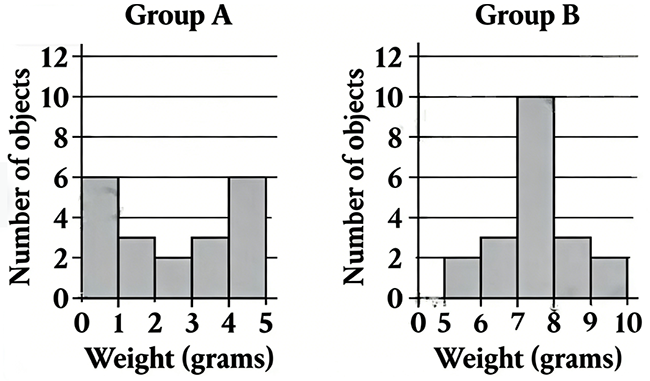
The mean weight of the objects in group A is equal to 2.9, and the mean weight of the objects in group B is equal to 7.9. Which of the following statements about the standard deviations of weight for the objects in these two groups is true?
原库参考解析
分布图表・极差与标准差基础
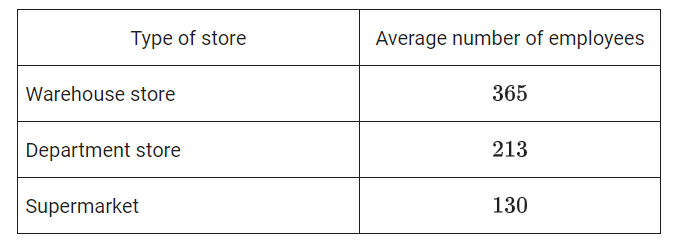
For a certain region, the table shows the average number of store employees in 2016 by type of store. Based on the table, how much greater was the average number of store employees in warehouse stores than in supermarkets?
原库参考解析
分布图表・极差与标准差挑战
The dot plots represent the distributions of values in data sets A and B.
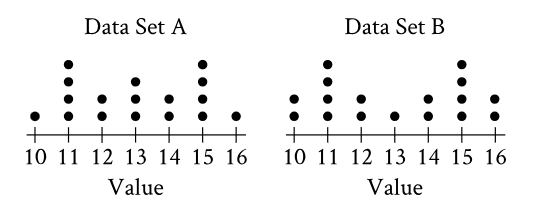
Which of the following statements must be true?
I. The median of data set A is equal to the median of data set B.
II. The standard deviation of data set A is equal to the standard deviation of data set B.
原库参考解析