
5272道题目5525 条题源记录 · 相同内容已合并
分布图表・极差与标准差基础
To study the characteristics of sea stars in a group of tide pools, researchers measured the diameter of the sea stars within the tide pools. The dot plot gives the diameter, to the nearest inch, of each of the sea stars in these tide pools.
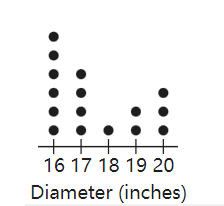
Based on the dot plot, how many sea stars had a diameter, to the nearest inch, of 16 inches?
原库参考解析
分布图表・极差与标准差进阶
4,4,4,4,8,8,8,13,13
Which frequency table correctly represents the data listed?
原库参考解析
分布图表・极差与标准差进阶
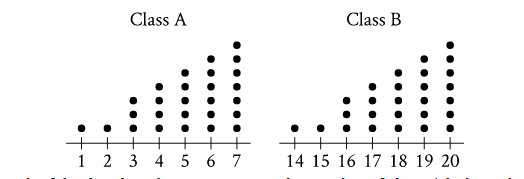
Each of the dot plots shown represents the number of glue sticks brought in by each student for two classes,class A and class B. Which statement best compares the standard deviations of the numbers of glue sticks brought in by each student for these two classes?
原库参考解析
分布图表・极差与标准差基础
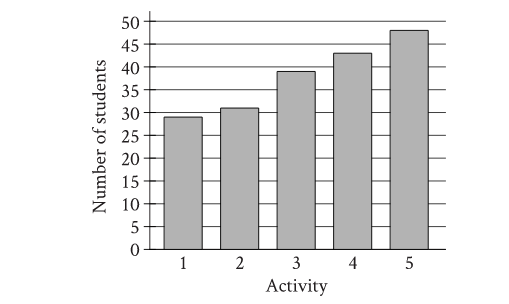
A group of students voted on five after-school activities. The bar graph shows the number of students who voted for each of the five activities. How many students chose activity 3?
原库参考解析
分布图表・极差与标准差基础
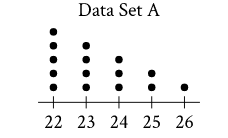
The dot plot represents the 15 values in data set A. Data set B is created by adding 56 to each of the values in data set A. Which of the following correctly compares the medians and the ranges of data sets A and B?
原库参考解析
分布图表・极差与标准差基础
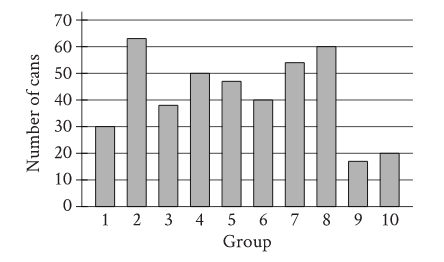
The bar graph shows the distribution of 419 cans collected by 10 different groups for a food drive. How many cans were collected by group 6?
原库参考解析
分布图表・极差与标准差挑战
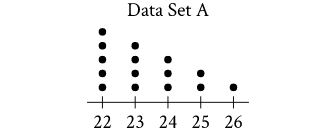
The dot plot represents the 15 values in data set A. Data set B is created by adding 56 to each of the values in data set A. Which of the following correctly compares the medians and the ranges of data sets A and B?
原库参考解析
分布图表・极差与标准差挑战
23, 27, 27, 32, 35, 36, 52
What is the range of the 7 scores shown?
原库参考解析
分布图表・极差与标准差进阶
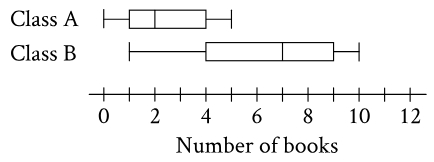
The two box plots show the distribution of number of books read over the summer by the students in two different English classes. What is the positive difference between the ranges of number of books read over the summer for the two classes?
原库参考解析
分布图表・极差与标准差基础
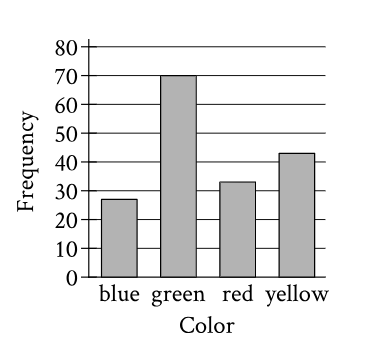
A data set consists of 173 colors. The bar graph shows the number of times each color appears in the data set. Which color appears 70 times?
原库参考解析
分布图表・极差与标准差挑战
The bar graph summarizes the charge, in kilowatt-hours (kWh), a battery received each day for 15 days.
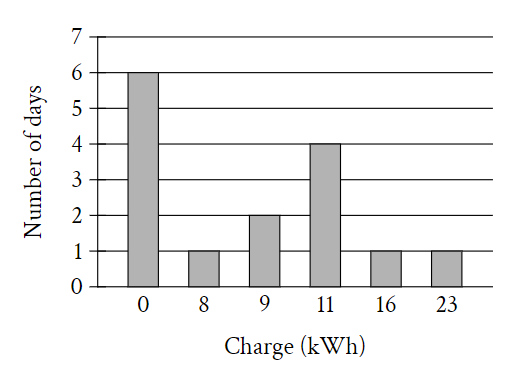
For how many of these 15 days did the battery receive a charge of 0 kWh?
原库参考解析
分布图表・极差与标准差进阶
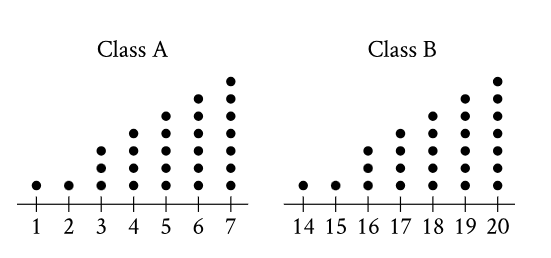
Each of the dot plots shown represents the number of glue sticks brought in by each student for two classes, class A and class B. Which statement best compares the standard deviations of the numbers of glue sticks brought in by each student for these two classes?
原库参考解析